Imagine yourself working on improving the performance of a mobile app. You’re at your desk designing and implementing a cascade of exciting optimizations, but you’re still wondering: how will it behave in the wild, in particular with so many different network conditions?
At Codavel, we’re building a new protocol for improving mobile apps’ performance and that’s why this is a challenge we face every single day. Based on our daily work, I’ll guide you through getting real-world data so that you can start evaluating your end-users’ experience even before releasing anything out to the world. In other words, I’ll explain why we use the following table as a reference for typical network conditions:
| Country | Network | Latency | Packet loss |
| UK | WiFi | 10 ms | 0.2 % |
| Mobile (4G) | 25 ms | 0.2 % | |
| US | WiFi | 25 ms | 0.2 % |
| Mobile (4G) | 50 ms | 0.5 % | |
| Germany | WiFi | 25 ms | 0.2 % |
| Mobile (4G) | 50 ms | 0.2 % | |
| Japan | WiFi | 10 ms | 0.1 % |
| Mobile (4G) | 50 ms | 0.2 % |
Searching for typical network conditions
There’s a myriad of networks, requests profiles, devices, locations and a lot more that affects the performance of a mobile app from the network perspective. In order to evaluate how fast the app is, you can release it so that you learn from data from your users in the real world, but this iteration cycle is too long for an endeavor that requires fast learning and testing (and you don’t want the end-user to suffer from potential miscalculations). Even with some beta release for a subset of users, the learning cycle can be too long.
Before the end-user (or the beta end-user), you should test performance in your lab environment. You have to have a way to simulate different network conditions (you can always use our network emulator), which are largely dominated by two network variables: latency and packet loss. So, you’ll have to give these variables as an input to your emulated setup, and the question arises: what latency and packet loss are representative of real-world network scenarios?
Bad news: latency and packet loss data about commercial networks are surprisingly hard to find.
Let me focus on a specific challenge we faced. We saw this interesting Google’s report on mobile page speed in the United States, Germany, Japan, and the United Kingdom, and we wondered: how will Bolina perform in these cases where load times are so high? (Not the purpose of this post, but let me tell you that Bolina reduces load times by more than 50%.)
We went after data that could help us classifying network conditions in the four countries that the study analyzed, to understand if that would relate to the findings of Google’s report. And although the study was performed with devices connected to 4G networks, we also wanted to know what would be user experience if WiFI networks were used.
Nothing better than your home network, right?
We started to look at studies made by the FCC in the US and by Ofcom in the UK based on SamKnowns hardware. Although these studies were focused on the wired broadband quality instead of mobile links, the data indicates that even on wired connections, the users could experience between 10 and 20 milliseconds of latency and up to 0.4% of packet loss, and that’s if we considered only fiber networks. Doesn’t sound too much, right? We’ll get to that later, but just a teaser: Assuming 0.2% of packet loss and 25ms of latency, it typically takes more than a second to fetch a web page.
Getting similar data for wireless scenarios was extremely difficult as very little information on latency and packet loss is publicly available. But then we found a very interesting tool developed by Riot Games’ team (seriously guys, amazing work!) that has network data points for different countries and for different internet providers, based on the connection from their app to their game servers. This tool not only has a huge amount of data, but it also has the right information if you are interested in knowing the quality of your network link: latency and packet loss. It also separates data between Ethernet and WiFi. We collected data of the former for the major cities of the four countries mentioned above, and these were the overall results:
| WiFi in: | US | UK | Germany | Japan |
| Latency | 25ms | 10ms | 25ms | 10ms |
| Packet loss | 0.2% | 0.2% | 0.2% | 0.1% |
Once again, this data shows that you should always expect to have some packet loss, as well as having latency going up to 60 milliseconds even at your home network.
What about 4G networks?
If searching for network data for Wi-Fi networks was not easy, doing the same for 4G networks was even harder. Not that there aren’t any reports, but they focus mainly on connectivity and throughput, and that does not translate directly into user experience. Reports like the ones from OpenSignal (for example, this one) or from Ookla are very useful to understand the latency that the user may experience when using their mobile phones to connect to different services, using a cellular network. However, user experience can significantly deteriorate if the device suffers from packet loss, something that these studies do not take into consideration (or at least something that they did not share publicly).
There are reports, like this one from Tutela, that take a different approach. Although they do not state directly what packet loss or latency they measure for each country, they created thresholds, Excellent and Core, and defined a set of metrics that a network must ensure to fit in each threshold. For example, they consider that a network with less than 50 milliseconds of latency and up to 1% of packet loss (among other parameters) is a network of excellent quality, and the country with the highest percentage of connections with excellent quality has 90% (which is Japan, in case you are wondering). The other countries we analyzed (UK, US and Germany) are somewhere between 70% and 75%.
Since we were unable to find any studies with data for the packet loss for 4G networks, based on the Tutela’s report and the data we have collected, we consider values between 0.2% and 0.5% as the reference value for the packet loss in 4G connections.
| 4G in: | US | UK | Germany | Japan |
| Latency | 50ms | 25ms | 50ms | 50ms |
| Packet loss | 0.5% | 0.2% | 0.2% | 0.2% |
Aggregating all this data, you get the table I’ve shared in the very beginning of this post. I’ll leave it here again for easy reading.
| Country | Network | Latency | Packet loss |
| UK | WiFi | 10 ms | 0.2 % |
| Mobile (4G) | 25 ms | 0.2 % | |
| US | WiFi | 25 ms | 0.2 % |
| Mobile (4G) | 50 ms | 0.5 % | |
| Germany | WiFi | 25 ms | 0.2 % |
| Mobile (4G) | 50 ms | 0.2 % | |
| Japan | WiFi | 10 ms | 0.1 % |
| Mobile (4G) | 50 ms | 0.2 % |
Typical app behavior, from HTTP requests point of view
Now, we’re not building a mobile app at Codavel, we’re building Bolina, a new protocol to improve mobile apps performance. That means that we not only have to emulate network conditions but also emulate mobile apps “network” behavior, from the point of view of requests to the network.
Looking at the reports available in https://httparchive.org/reports, we see that the average size for an image is around 500KB, while the average size of an entire webpage is 2MB, values that we used as a baseline.
Then, we tried to gather data for a more complex app usage, but we failed to find any public report with information regarding the network behavior for the most used mobile apps. So, as an alternative, we analyzed the traffic coming in and out of mobile devices while using some well-known social media apps and extracted the number of requests and file sizes for two different scenarios: opening the app and scrolling through an image gallery.
The following table summarizes the HTTP requests profiles that we daily use to test Bolina.
| HTTP Requests Profile | ||
| Action | # Requests | Total Response Size (MB) |
| Open a Social Networking App | 17 | 12.66 |
| 2 | 2 x 0.0000095 | |
| 5 | 5 x 0.2393 | |
| 6 | 6 x 0.4932 | |
| 2 | 2 x 1.1 | |
| 1 | 1 x 1.9 | |
| 1 | 1 x 4.4 | |
| Scroll down a Social Networking App | 21 | 20.08 |
| 2 | 2 x 0.0000095 | |
| 3 | 3 x 0.2393 | |
| 5 | 5 x 0.4932 | |
| 6 | 6 x 1.1 | |
| 6 | 6 x 1.9 | |
| Image Download | 1 | 0.49 |
| Webpage Download | 1 | 1.90 |
How much can the network impact UX?
Now that you know what range of values you can expect for packet loss and latency for different regions and technologies, and the amount of data that an app can download, you must be wondering if those values have any impact on user experience, right? Short answer: they can make a huge difference. You can check our recent post with performance data from Uber to get a glimpse of how unstable networks can get.
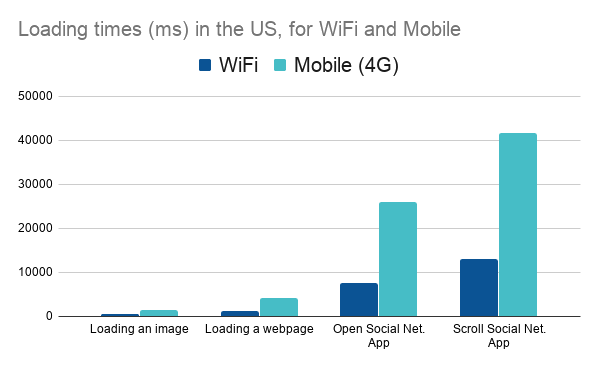
From the end-user perspective, using an app over a 4G connection can be more than twice as slow when compared to the WiFi case. Is your app ready to cope with such a variation in user experience?
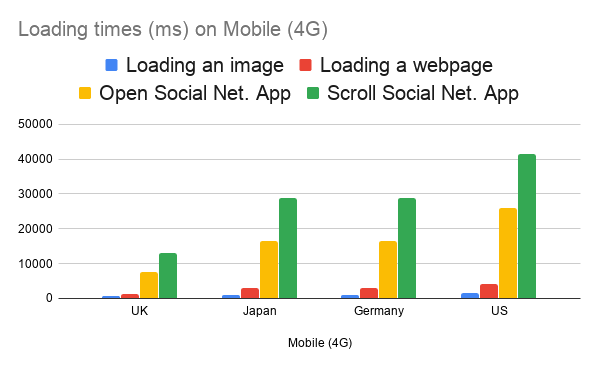
Geography, or location, also matters. A lot! It can get two times slower in the US when compared to the UK. And this fluctuation can get even more dramatic when you look at a city block level!
Curious about how much Bolina can decrease these load times? Check our performance report and find out. Heads up: it’s a lot.
Next steps
Having a performance report published does not mean at all that we can stop searching for new use cases and tune our definition of networks. We are continuously looking for new data to evolve our lab environment. In case you have information that could be helpful towards this never-ending task, either network stats or app usage, please drop us an email!
In case you are curious about Bolina's application, we have two use-cases (video streaming and social networks) available here.