
Codavel Performance Service is built on top of our core technology, Bolina, a mobile-first network protocol. Apart from delivering the best network experience possible to all our users, our main goal is to make our protocol as easy to use as HTTP, so that it can be integrated into any service in a few minutes.
For us, this meant creating a mobile SDK that requires only a few lines of code to enable Bolina on any Android or iOS app, and a server cluster that not only can be quickly deployed into any infrastructure but is also able to scale, so that it can cope with the millions of requests per seconds we aim to serve. And while the old-school engineer that lies in me glows with the beeps thrown by a physical computer booting up or 1000+ lines of custom installation scripts, large scale deployments should definitely make use of automated workflows. In the following paragraphs I will explain why we choose Kubernetes to help us with that.
Our Service, the ins and outs
But first let me explain the basics of how we designed our integration of the Bolina Protocol with HTTP:
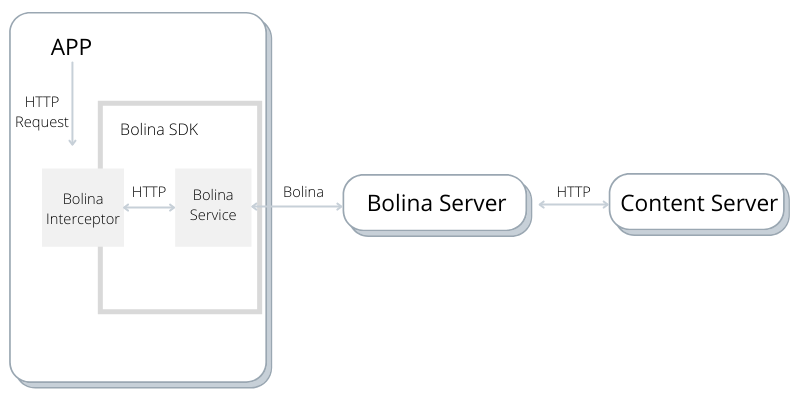
When the Client enables our mobile SDK, it starts intercepting all the configured HTTP requests made by the App, and redirects them to a local service running on the device, managed by our SDK. This service is responsible for translating those requests into our Bolina Protocol, and sending them to our servers through a secure Bolina connection. The Bolina server is responsible for almost the opposite operation, as it processes the Bolina requests and translates them back into HTTP. Then, it fetches the resource from the Content Server, as a regular HTTP client would, and sends the data back to Client through the same Bolina connection. Pretty simple, right?
And while establishing a connection between a client and one specific server is pretty straightforward, as the number of clients that use our service increases a few more challenges arise:
- How do we know how many clients each server should handle simultaneously?
- How do the clients know to which server should they connect to?
- How do we scale the number of servers when needed?
With these questions in mind, the first thing we tackled was finding a way to detect the capacity of each server. Performance is at the core of any communication protocol and Bolina is no different, so we had to ensure that all the effort we put in making Bolina as fast as we could was not being limited by external (protocol-speaking) bottlenecks, such as the number of open connections or lack of resources to perform all the required tasks.
One common solution is to monitor the Instance’s CPU and/or memory usage and evaluate if the measured values are under a certain threshold. But as we have full control of the entire process running on the server, we felt that we could include a few more metrics, such as the number of bytes processed, the number of requests per second, even the processing time of each event of the process’s main loop, and so on. This allowed us to have a higher granularity about each server availability and, most importantly, to quickly detect if a server was reaching its maximum capacity and avoid that server from increasing the number of open Bolina connections.
Based on these metrics, we divided the Bolina Server availability into three different stages:
- Available: Server is below its capacity, and is ready to accept new clients.
- Warning: Server is reaching its maximum capacity, and it should not accept new clients in order to stabilize its usage and avoid getting into the Critical stage.
- Critical: Server is above its capacity, and the overall performance could be affected. It should stop receiving traffic until it drops at least to a Warning stage.
But how to know which servers are running?
After guaranteeing that each Bolina Server could accurately determine its availability, the next step was to aggregate that information into a service that another entity, such as a load balancer, could query and be able not only to get a list of available servers, but to determine which one would be more suitable to receive a new client.
Let’s take the following JSON as an example of the information that a load balancer could receive:
[
    {
        "Address": {
            "IP": "1.2.3.4",
            "Port": {
            "TCP": 9001,
            "UDP": 9002
            }
        },
        "Metadata": {
            "ServerID": "805390934",
            "Status": "available"
        }
    },
    {
        "Address": {
            "IP": "5.6.7.8",
            "Port": {
            "TCP": 9001,
            "UDP": 9002
            }
        },
        "Metadata": {
            "ServerID": "202130133",
            "Status": "warning"
        }
    }
]
Based on this information, the Load Balancer knows that there are two Bolina Servers running, and that one of them is in the “Warning” state. If a client opened a new connection at this stage, the decision should be to redirect it to the server “805390934”, with the address 1.2.3.4, since it has more capacity than the other.
To store that information, we decided to use Consul, a distributed and highly available service mesh system, that allowed us to quickly set up a system to where all the servers could efficiently communicate. Consul also has custom health checks, available through an HTTP API, to where the servers could periodically send their availability and, as a bonus, a distributed Key-Value store that we could utilize to share relevant information for the entire cluster of servers.
Regarding its architecture, it basically consists of a cluster composed of at least 3 consul agents (running in server mode), to where other agents (running in client mode) could connect to and communicate through gossip protocol. To integrate with Consul, each Bolina Server is deployed alongside a consul agent, as a “sidecar”, which is responsible to receive the server’s HTTP messages describing its availability and propagate the information to the consul cluster, where, as we were aiming, we have an aggregated view of all the running instances.
Great! Now I want more servers
Now that we defined the model to detect the availability of a Bolina Server, and a Service from where we could fetch the status of all Bolina Servers, we moved on to the next problem: how to use that information? (of course we already knew what to do, but it is just for the sake of the writing flow).
As described previously, each Bolina Server acts basically as an HTTP proxy, not storing any of the requested resources. This means that, apart from the data that is currently being transferred between Client and Server, each instance is pretty much stateless and each Bolina Server is able to handle data from any Bolina Client, independently of having a previous established session or not. So, in terms of scaling our Service, our concern is“only” (and I need to emphasize the “”) to ensure a number of Bolina Servers that are capable of serving all the Client’s requests at any given time.
Coupling this requirement with the definition of availability above, we defined that the system should always have the percentage of servers in the “Available” state above a certain threshold, to act as safeguard, as available capacity. Each time the percentage dropped below that value, a new instance should be spawned. To guarantee that, we developed a custom watcher for the Consul cluster, that is notified each time that a Server changes its availability or there is a change in the number of instances running. If required, this service is also responsible to scale the deployment to the necessary number of instances. Since we put all our creativity into the development of the products, we simply named it Bolina Scaler.
This leads us to the final challenge: what is the most efficient way to create and launch new instances? How to ensure that the number of running instances at a given time is what we intended? And although we have Codavel Performance Service, composed by the necessary number of Bolina Servers, running in our own infrastructure, how could we make it easier for anyone that is interested in deploying Bolina on their infrastructure? Here comes Kubernetes!
Show me some code!
Bolina Servers were always a nice fit for containers. The stateless nature of the service enabled us to deploy in an isolated and immutable environment. However, as the number of connected clients grows, the number of required containers to handle all that traffic also increases significantly, and we had to ensure that we were able to deploy and orchestrate all of those efficiently, while at the same time guaranteeing that they were fault tolerant and able to communicate with all the other necessary components within the cluster. Kubernetes addresses all of those concerns.
Keeping things very simple, its architecture consists of one or more (typically much more) physical/virtual hosts, called Nodes, divided into one master node and worker nodes. As you may have guessed, the master is responsible for managing and orchestrating the cluster, while the workers run all the necessary containers and associated tasks. After defining what you want to be deployed (more on that in a few lines), Kubernetes is responsible for managing the system so that it always matches your configuration. This means that it distributes the workload between all the available workers, in a virtual network where all the containers can find the others and communicate with each other, and is constantly verifying that the current state (in terms of service’s configuration and number of running instances of each service) is always the intended.
Through its automated rollouts and rollbacks, It also makes it very easy and fast to horizontally scale up or down the deployment, as it boils down to starting or terminating containers, which allow us to quickly adapt to the natural variation in the number of connected Bolina clients without any downtime, and efficient in terms of the resources being used.
By now you are probably getting tired of all the writing and just waiting to see some code, right? So buckle up, a lot of k8s terminology coming:
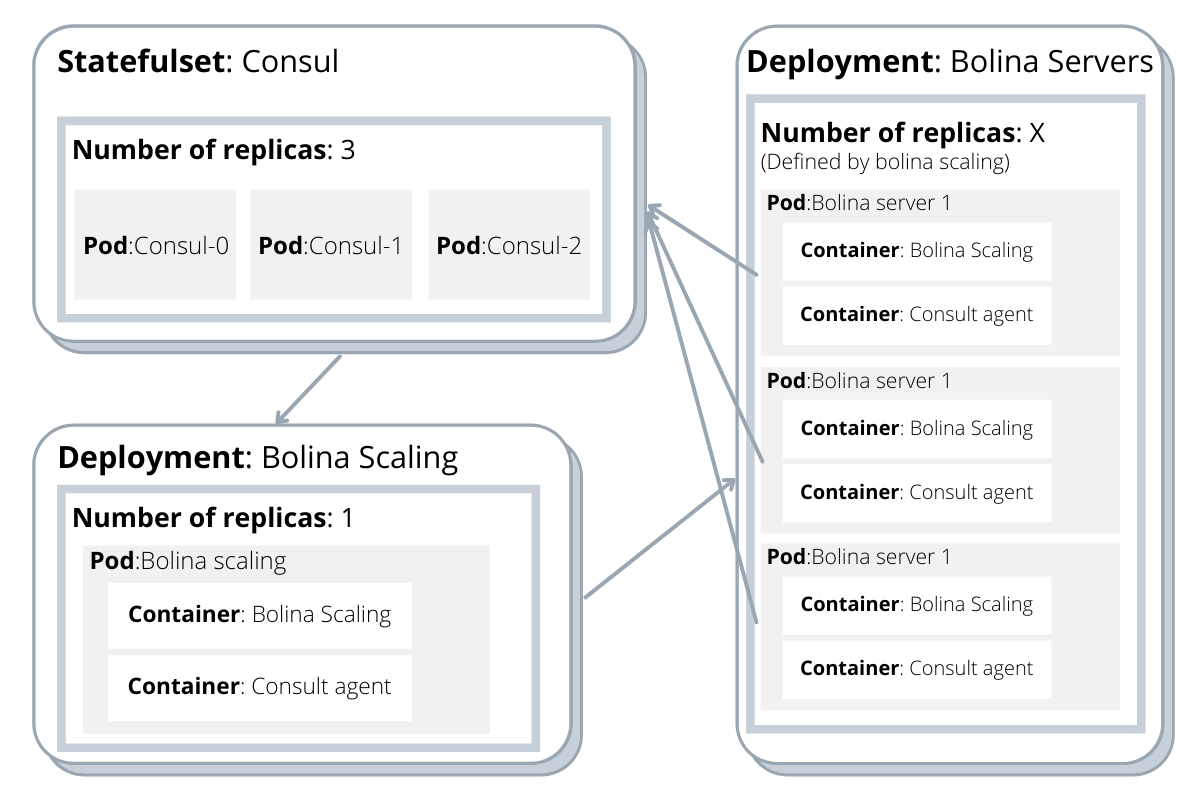
First we deployed a statefulset with three replicas and a persistent volume associated, to deploy the Consul agents running in server mode. This creates the Consul server cluster, while ensuring that all data is kept safely, even if one of those containers stops.
---
apiVersion: apps/v1
kind: StatefulSet
metadata:
  name: consul
spec:
  selector:
    matchLabels:
      app: consul
      component: server
  serviceName: consul
  podManagementPolicy: "Parallel"
  replicas: 3
  template:
    metadata:
      labels:
        app: consul
        component: server
      annotations:
        "consul.hashicorp.com/connect-inject": "false"
    spec:
      serviceAccountName: consul
      affinity:
        podAntiAffinity:
          requiredDuringSchedulingIgnoredDuringExecution:
            - labelSelector:
                matchExpressions:
                  - key: app
                    operator: In
                    values:
                      - consul
              topologyKey: kubernetes.io/hostname
      terminationGracePeriodSeconds: 10
      containers:
        - name: consul
          image: consul:latest
          env:
            - name: POD_IP
              valueFrom:
                fieldRef:
                  fieldPath: status.podIP
            - name: CONSUL_ENCRYPTION_KEY
              valueFrom:
                secretKeyRef:
                  name: consul
                  key: consul-encryption-key
          args:
            - "agent"
            - "-advertise=$(POD_IP)"
            - "-bootstrap-expect=3"
            - "-config-file=/etc/consul/config/server.json"
            - "-encrypt=$(CONSUL_ENCRYPTION_KEY)"
          volumeMounts:
            - name: consul-config-server
              mountPath: /etc/consul/config
          lifecycle:
            preStop:
              exec:
                command:
                - /bin/sh
                - -c
                - consul leave
          ports:
          - name: server-rpc
            containerPort: 8300
            protocol: "TCP"
          - name: consul-dns-tcp
            containerPort: 8600
            protocol: "TCP"
          - name: consul-dns-udp
            containerPort: 8600
            protocol: "UDP"
          - name: http
            containerPort: 8500
            protocol: "TCP"
          - name: serflan-tcp
            protocol: "TCP"
            containerPort: 8301
          - name: serflan-udp
            protocol: "UDP"
            containerPort: 8301
          - name: serfwan-tcp
            protocol: "TCP"
            containerPort: 8302
          - name: serfwan-udp
            protocol: "UDP"
            containerPort: 8302
      volumes:
        - name: consul-config-server
          configMap:
            name: consul-config-server
The config itself is pretty much self-explanatory, but please note the podAntiAffinity section. That forces each of the Consul pods to be placed on a separate node, to avoid losing connectivity in case all the pods were placed on the same node and that node failed.
To communicate with that cluster, we deployed Consul agent clients as a sidecar for each Bolina Server, to reduce the latency in the communication between them. Translating that into Kubernetes language, it means that each Bolina instance is a pod composed of two containers: the Bolina Server itself and a Consul agent.
The cluster of Bolina servers is defined as a deployment, where the number of replicas equals the number of desired running instances, all connected and registered in the Consul cluster, and ready for action. Note that we set the number of replicas to 0. This is not an error, as the Bolina Scaler will be the one responsible for changing that value dynamically.
---
apiVersion: apps/v1
kind: Deployment
metadata:
  name: bolina
spec:
  replicas: 0
  selector:
    matchLabels:
      app: bolina
      component: server
  template:
    metadata:
      labels:
        app: bolina
        component: server
    spec:
      terminationGracePeriodSeconds: 60
      containers:
      - name: bolina-server
        Image: bolina-image

        ports:
           - name: bolina-tcp
             containerPort: 9001
             hostPort: 9001
             protocol: TCP
           - name: bolina-udp
             containerPort: 9002
             hostPort: 9002
             protocol: UDP
      - name: consul-bolina
        image: consul:latest
        env:
        - name: CONSUL_ENCRYPTION_KEY
          valueFrom:
            secretKeyRef:
              name: consul
              key: consul-encryption-key
        - name: POD_IP
          valueFrom:
            fieldRef:
              fieldPath: status.podIP
        lifecycle:
          preStop:
            exec:
              command:
                - /bin/sh
                - -c
                - consul leave
        args:
            - "agent"
            - "-advertise=$(POD_IP)"
            - "-config-file=/etc/consul/config/client.json"
            - "-encrypt=$(CONSUL_ENCRYPTION_KEY)"
        volumeMounts:
          - name: consul-config-client
            mountPath: /etc/consul/config
        ports:
          - name: server-rpc
            containerPort: 8300
            hostPort: 8300
            protocol: "TCP"
          - name: consul-dns-tcp
            containerPort: 8600
            hostPort: 8600
            protocol: "TCP"
          - name: consul-dns-udp
            containerPort: 8600
            hostPort: 8600
            protocol: "UDP"
          - name: http
            containerPort: 8500
            hostPort: 8500
            protocol: "TCP"
          - name: serflan-tcp
            protocol: "TCP"
            containerPort: 8301
            hostPort: 8301
          - name: serflan-udp
            protocol: "UDP"
            containerPort: 8301
            hostPort: 8301
          - name: serfwan-tcp
            protocol: "TCP"
            containerPort: 8302
            hostPort: 8302
          - name: serfwan-udp
            protocol: "UDP"
            containerPort: 8302
            hostPort: 8302
      volumes:
        - name: consul-config-client
          configMap:
            name: consul-config-client
As for the scaling itself, and as i explained previously, the number of Bolina servers is calculated by our Bolina Scaler service. Since all the data is kept and managed by our Consul cluster, this service is also stateless. So, in order to deploy it in our Kubernetes Cluster, we simply created a deployment, similar as the one for the Bolina Servers:
---
apiVersion: apps/v1
kind: Deployment
metadata:
  name: watcher
spec:
  replicas: 1
  selector:
    matchLabels:
      app: watcher
      component: server
  template:
    metadata:
      labels:
        app: watcher
        component: server
    spec:
      terminationGracePeriodSeconds: 10
      containers:
        - name: watcher
          image: watcher-image
          env:
            - name: POD_IP
              valueFrom:
                fieldRef:
                  fieldPath: status.podIp
          volumeMounts:
           - name: kube-config
             mountPath: /usr/src/app/config
             subPath: config
        - name: consul-watcher
          image: consul:latest
          env:
            - name: CONSUL_ENCRYPTION_KEY
              valueFrom:
                secretKeyRef:
                  name: consul
                  key: consul-encryption-key
            - name: POD_IP
              valueFrom:
                fieldRef:
                  fieldPath: status.podIP
          lifecycle:
            preStop:
              exec:
                command:
                  - /bin/sh
                  - -c
                  - consul leave
         args:
            - "agent"
            - "-advertise=$(POD_IP)"
            - "-config-file=/etc/consul/config/client.json"
            - "-encrypt=$(CONSUL_ENCRYPTION_KEY)"
          volumeMounts:
            - name: consul-config-client
              mountPath: /etc/consul/config
          ports:
            - name: server-rpc
              containerPort: 8300
              protocol: "TCP"
            - name: consul-dns-tcp
              containerPort: 8600
              protocol: "TCP"
            - name: consul-dns-udp
              containerPort: 8600
              protocol: "UDP"
            - name: http
              containerPort: 8500
              protocol: "TCP"
            - name: serflan-tcp
              protocol: "TCP"
              containerPort: 8301
            - name: serflan-udp
              protocol: "UDP"
              containerPort: 8301
            - name: serfwan-tcp
              protocol: "TCP"
              containerPort: 8302
            - name: serfwan-udp
              protocol: "UDP"
              containerPort: 8302
      volumes:
        - name: consul-config-client
          configMap:
            name: consul-config-client
        - name: kube-config
          configMap:
            name: kube-config
Noticed the kube-config configuration? Well, if the number of desired instances changes at any given time, this service needs to interact with the cluster and give instructions to create or shutdown an instance. And here is another helpful tool: The Kubernetes API.
Since the Watcher is running inside the kubernetes cluster, we just needed to integrate the javascript API into our code and change the number of replicas of the Bolina deployment when required. It is up to kubernetes to ensure that our cluster has always the desired number of pods up and running.
async createInstances(desired_replicas) {
const current_deployment = await this.k8sApi.readNamespacedDeployment(this.name, this.namespace);
let deployment = current_deployment.body;
let previous_replicas = deployment.spec.replicas
deployment.spec.replicas = desired_replicas;

let new_deployment = await this.k8sApi.replaceNamespacedDeployment(this.name, this.namespace, current_deployment);
var number_of_replicas = c.response.body["spec"]["replicas"]
console.log(`Desired instance ${desiredInstances}. Running ${number_of_replicas} replicas`)
return number_of_replicas
}
}
The kube config file is what grants access for the service to modify the cluster.
As soon as we start the watcher, it will begin to monitor and update the number of Bolina Server replicas of the deployment to the desired starting instances, and the system is up and running.
That was easy!
If you read the above description of our deployment seems too simple, well… It’s because it is. Kubernetes is a great and easy-to-use tool that allows you to quickly deploy your service in any infrastructure, independently of your cloud provider, and with some great features that ensure the stability and robustness of your deployment. We strongly believe that you should focus most of your efforts into what you’re good at, and tools like Kubernetes help us focus more on delivering the best user experience possible to anyone through a modern transfer protocol, Bolina, and less on the infrastructure side.
Still, this is only a part of our product and there are a lot of challenges we faced when scaling to millions of users. For instance, things get a little bit more complicated when we start discussing how to access the kubernetes cluster from the wild (meaning, the internet), and how we do L4 load balancing for both UDP and TCP traffic, but that itself is enough content for one or two blog posts that you will be able to read soon (spoiler alert: Envoy is another great tool ;) ).