Network performance plays a key role in mobile apps success, and while we are working on improvement, we know that one of the crucial steps of the process is monitoring. But not every tool will give you the same insights, and that's why we previously made a top of mobile app monitoring tools. This time I decided to go further and help you understand how easy is the integration process of these tools in an actual mobile app, and what specific metrics each tool allows us to collect and measure.
This blog post focus on my experience integrating Firebase Performance Monitor. This tool is part of the Firebase portfolio, which offers multiple tools to help developers building better apps and keep improving them afterwards. In this case, my goal is to collect performance metrics of my app, which performs file transfers.
At this stage, the integration speed is particularly relevant to me. According to the documentation, this tool supports both Android and iOS operating systems and should be very easy to integrate, launch the app, and start seeing statistics through the Firebase Console.
System setup and test environment
Regarding the system setup for monitoring tools integration, my starting point is the Android app developed in
Regarding the hardware, I am using the same 2 setups used initially:
- OnePlus 5, with Android 9.0
- Android emulator, with a Nexus 5X API 28 x86 image, running on a 13-inch MacBook Pro 2017, with an i5 2.3GHz CPU and 8GB of RAM
Let’s now start
To start using Firebase Performance Monitor on my app, I followed the steps described in the Get Started Manual for Android. First, I went through the list of prerequisites, ensuring that my testing environment was properly set up. Second, I add Firebase platform to my project. To accomplish this task, two options are presented in Firebase documentation: do it via Android Studio or do it manually via Firebase console.
I took the first approach. In order to do that, at the Android Studio Window, I clicked on Tools -> Firebase to open the Assistant window. Then, since there was no specific option for Performance Monitoring and since I was not using any other Firebase features on my app, I followed the documentation instructions to expand one of the listed features (for example, Analytics). After clicking on the provided tutorial link, I clicked on the Connect to Firebase button, and Android Studio automatically added the necessary code to the App.
With Android Studio connected to Firebase, it should be easy to add Performance Monitoring to my app following the steps.
At the root-level build.gradle file, ensure that it contains:
Then, also on root-level build.gradle file, add the following:
At the app-level build.gradle file, add:
below
Also, at the app-level build.gradle file, add:
After gradle sync, I saw a warning on Android Studio:
“All com.android.support libraries must use the exact same version specification (mixing versions can lead to runtime crashes). Found versions 28.0.0, 26.1.0. Examples include com.android.support:animated-vector-drawable:28.0.0 and com.android.support:support-media-compat:26.1.0 less... (⌘F1)
Inspection info: There are some combinations of libraries, or tools and libraries, that are incompatible, or can lead to bugs. One such incompatibility is compiling with a version of the Android support libraries that is not the latest version (or in particular, a version lower than your targetSdkVersion). Issue id: GradleCompatible”
When I launched the app I got a crash, which was associated with the following error on logcat
java.lang.ExceptionInInitializerError
at com.google.firebase.perf.internal.RemoteConfigManager.zzcb(Unknown Source:17)
After a workaround on the compileSdkVersion, targetSdkVersion, and after changing
to
The warning disappeared, but the app still crashed with the same error.
To figure out the reason of the crash, I tried to build an app from scratch (instead of using the app that compares okhttp with httpurlconnection), having the minimum dependencies as possible. Using this approach, gradle warning disappeared, but the crash still remains after the integration with Firebase Performance Monitor.
Then, paying more attention to the documentation, I see the following:
“Note: When you add Performance Monitoring to your app, the Remote Config SDK is included as a dependency. If you already use Remote Config, you won't see any difference. However, if you're new to Remote Config, explore the Remote Config documentation to learn more about the various features you'll be able to access in your app.”
Having this note in mind and looking to the error I was getting, I decided to add Remote Config to my project, although I thought this was not a requirement for Performance Monitoring. To accomplish this task, from the Android Studio, I clicked to expand the Remote Config and set it up. This applied the required changes to the project automatically, as shown in the picture below.

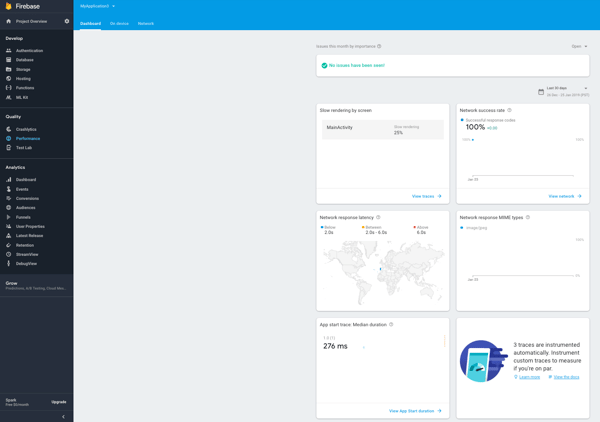
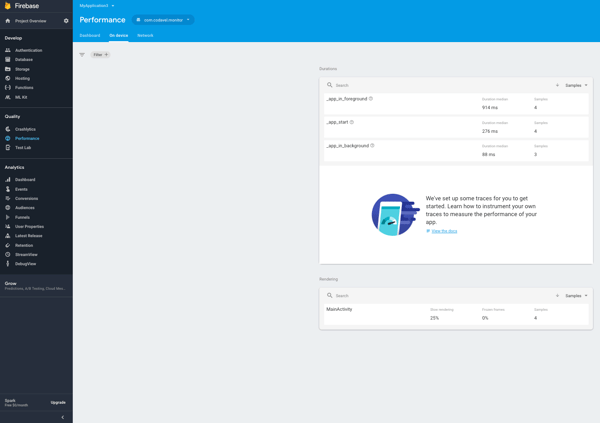
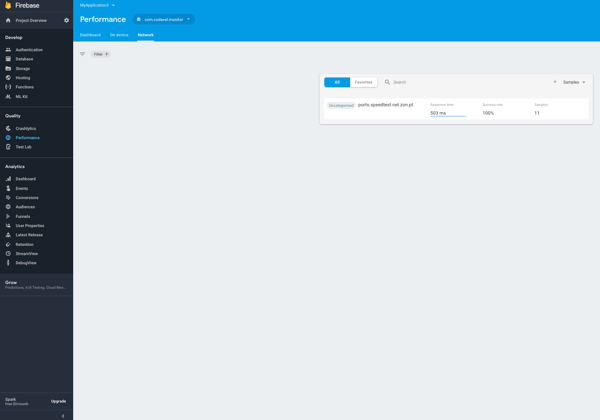
After that, I was able to compile and run the app successfully. Then, after running a few transfers, using both okhttp and httpurlconnection, I went to Firebase Console. It was pretty empty at that moment, showing up an information message stating that “Results should appear within 12 hours.” They did. A few hours later, I was able to see the information of my transfers in the Firebase Console, as shown in pictures below.
In addition to the default data and statistics collection, there are optional steps I did not explore. Namely, define custom traces and add the @AddTrace annotation to trace specific methods. More information about these features can be found here.
Final remarks
After struggling a bit, I was able to integrate Firebase Performance Monitoring into my Android app and visualize the results in the Firebase Console.
In my opinion, few integration steps do not necessarily mean an easy and smooth integration process. More important than having a 2 line of code integration process is to have good documentation not only explains how to integrate but also covers most of the common mistakes, known incompatibility issues and detailed FAQs. At the end of the day, this is valuable information that can save hours of integration time.