As we’ve discussed in a previous blogpost, a careful management of every network request will improve the performance of your system/application. But there is a catch. There is always a catch! Monitoring single network requests will give you limited information, and the data of every single request may lead you to infer conclusions that are not true at all. So, to tackle this problem, we at Codavel provide a way to capture multiple requests or a sequence of requests, which we called actions, that facilitates tracking KPIs that matter to you, while adding a few more user-specific metrics for a better understanding of the results.
How to track actions
What is the mechanism that we provide in our Mobile SDK to track sequences of requests? A very simple and effective one if you ask me. Furthermore, this service is simple to understand and it only has two components, each one is composed of multiple parts. To explain each component, we will start by introducing all the parts (see fig1), and then explain each one in depth.
.png?width=432&name=unnamed%20(3).png)
(Figure 1 - System architecture)
The first and most important one, the mobile SDK, that not only allows you to improve the user’s experience but also provides a way to monitor it. It’s here, in this SDK that the magic happens. It grants our customer a way to control every part of the lifecycle of an action.
The second one, the Analytics Service, a software or system that could be used to aggregate, store and visualize information. At Codavel we are strong defenders of the ELK stack stack, but you could use other systems that have the same features.
Introducing the ActionInfo
Now that you have a global perspective of our “little” service, it is important to understand the concepts that define each action. In this case, the atomic unit is the object ActionInfo.
ActionInfo is a class constituted with multiple attributes that have the objective of facilitating the tracking of the sequences. Some of these attributes are described in the following UML diagram.
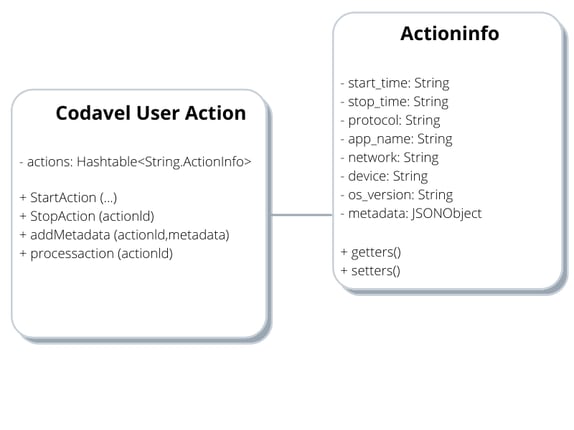
(Figure 2 - ActionInfo UML Class Diagram)
The first two attributes, start_time and stop_time, are used to calculate the duration of each action, which should be the most relevant info you will be looking at when analysing the data of your users. But after seeing the time it took to perform such action, you may want to get into details, such as:
- For each type of device?
- Which types of network?
- And in some rare cases, what happened for that specific user?
To help with those questions, we include for each action the following information:
- Protocol: Custom value that you may use to identify the Protocol used (e.g, Bolina, HTTP, …)
- App name: the package name or bundle identifier of the application
- Network: the type of network where the user performed the action (WiFI, 4G, …)
- Device: the model of the device
- OS Version: The version of the operating system of the user
And in case those metrics are not enough, we also provide a Metadata attribute, defined as a JSONObject, that serves the purpose of giving the user the flexibility for any new metrics to be monitored. This way, Codavel allows our customers to monitor any kind of information, allowing them to analyse their KPIs more easily and with richer information.
Now that we explained how an action is saved, another question comes to mind. How do we control the lifecycle of those same actions being monitored? How does this information go to the Analytics Service? For that, we introduced the CodavelUserAction.
The CodavelUserAction
The BolinaUserAction is the wrapper class around ActionInfo and the one that controls the lifecycle of an action. As mentioned previously, we allow our customer the flexibility to choose at which point they want to send this information, as well and when to start and stop the monitoring of the action. But why did we implement the service this way?
Giving our customer the control of every action, especially when they want to trigger the send method to the analytics centre, has multiple advantages. It allows to not overwork the network with all the actions being sent at the same time, as well as not overworking the application. It allows our customer to send the data whenever he wants. If they want to define priorities on which action will be sent first, they can do that. They can even initialize a thread to send stats at a given period in background. They have full control. On the other hand, providing it as a library gives transparency and a better understanding of what is done under the hood, leading to, we hope, a better use of this functionality. But enough with the advantages, let’s see how we implemented this logic.
Internally, BolinaUserAction is composed of a HashTable (of actionId and ActionInfo) and four methods: startAction, stopAction, addMetada and processAction. To better understand how to use this methods, let us define the following use case:
“You want to track how much time does your app need to initialize, to later transform directly into the metric startup time”
So, you start by invoking the startAction method passing the arguments that will create the ActionInfo object internally and add it to the hashMap. This method will return the actionId, allowing you to track which action was created. This id is very important and must be saved, as it will be used to control the processing and stop methods.
In our use case, once the app has finished initializing, you want to stop tracking the time, so naturally, you invoke the method stopTime and pass the actionId as an argument. Now, when you decide that this user action has finished, you can invoke the processAction using the actionId. This way, the method internally will transform the ActionInfo into JSON and send it to the Analytics Center through an HTTP request.
The addMetada method
If you thought we forgot about the addMetadata method, you are wrong. Due to its importance, it will be discussed here alone in this section. To start, it is an optional method. Its main purpose is to add parameters to the ActionInfo, giving our customer the flexibility to track any kind of info that would be relevant, and add it to the action object.
To better understand how important can this method be, a simple use case must be defined:
“When scrolling through social media, we want to see how many times thumbs-ups or likes the user may give.”
This may seem a ridiculous request, but once you are tracking the time a user is spending on scrolling, you may as well monitor things like “likes”. This will give you additional information about the action and could be translated in some more richer metric. So, once you stop tracking the requests, invoking the addMetadata method and passing the JSONObject with the number of likes inside is enough to guarantee that the extra information is saved.
Putting word into code
Translating the previous logic into code, were created the following two snippets. One, written on Java, with the objective of the code to run on Android devices and the other, written on Swift, providing a way to run on IOS platforms:
|
int numberOfLikes = 0 |
(Code snippet 1 - Android code)
|
let numberOfLikes:int = 0 |
(Code snippet 2 - Swift code)
And then, once you invoke the processAction, all this extra information will be sent to the Analytics Centre. It couldn’t be easier. It should be noted that addMetadata should be invoked before processAction, otherwise, all the extra information will not be sent.
Visualizing your KPI’s
Now that we explained how to track actions in an application, we need to understand how the results could be used to better analyse the KPIs that are relevant to you.
All of this happens on Analytics Service, which in our case is an ELK stack deployment, divided in three different componentes.
The first one, the Logstash that will receive all the information of the sequence that was sent by the application. The second one, the ElasticSearch that has the objective of indexing the data. The last one, the Kibana that has the job of showing the data through the form of dashboards.
Below (in fig 3), you can see the dashboard that we provide in our product, which has the objective of letting the customer compare the cumulative time of each action for Bolina and HTTP, for all his users. And remember the user-specific metrics that we add for each action? Thanks to those, these results can be filtered by the type of device, network or even client location, giving our customer a powerful tool for a better understanding of what’s affecting its users’ experience.
-2.png?width=682&name=unnamed%20(1)-2.png)
(Figure 3 - Dashboards related to Action Info)
Other metrics, like the comparison of the action duration for several percentiles (see fig 4 X), can give you a better idea of how the Bolina service is doing in relation with HTTP.
-1.png?width=675&name=unnamed%20(2)-1.png)
(Figure 4 - Dashboards related to Action Info)
Conclusion
We at Codavel, care about performance and care about optimizing code to run faster. We also care about our customer’s business. This is the principal motivation behind our company.
We want our customers to better understand their users' behaviour and experiences. So, we found a way to let our customer know. We defined one way to track r actions and to fuel your KPI’s. And to make it easier to visualize, we even design some useful dashboards.
In sum, we defined an environment where with the use of the Bolina Mobile SDK, our customer can track actions as it pleases, as well as a default way to compute the information harvested. In the long term, these actions provide better results to your company and better use of company resources.