While developing Bolina to improve app performance, we understood that constantly measuring the user experience is key to a successful app. After all, a bad user experience can cost a lot of money. Therefore, app owners should always assume app improvement as a continuous process that depends on monitoring and testing.
.png?width=600&name=Content%20delivery%20ecosystem%20(1).png)
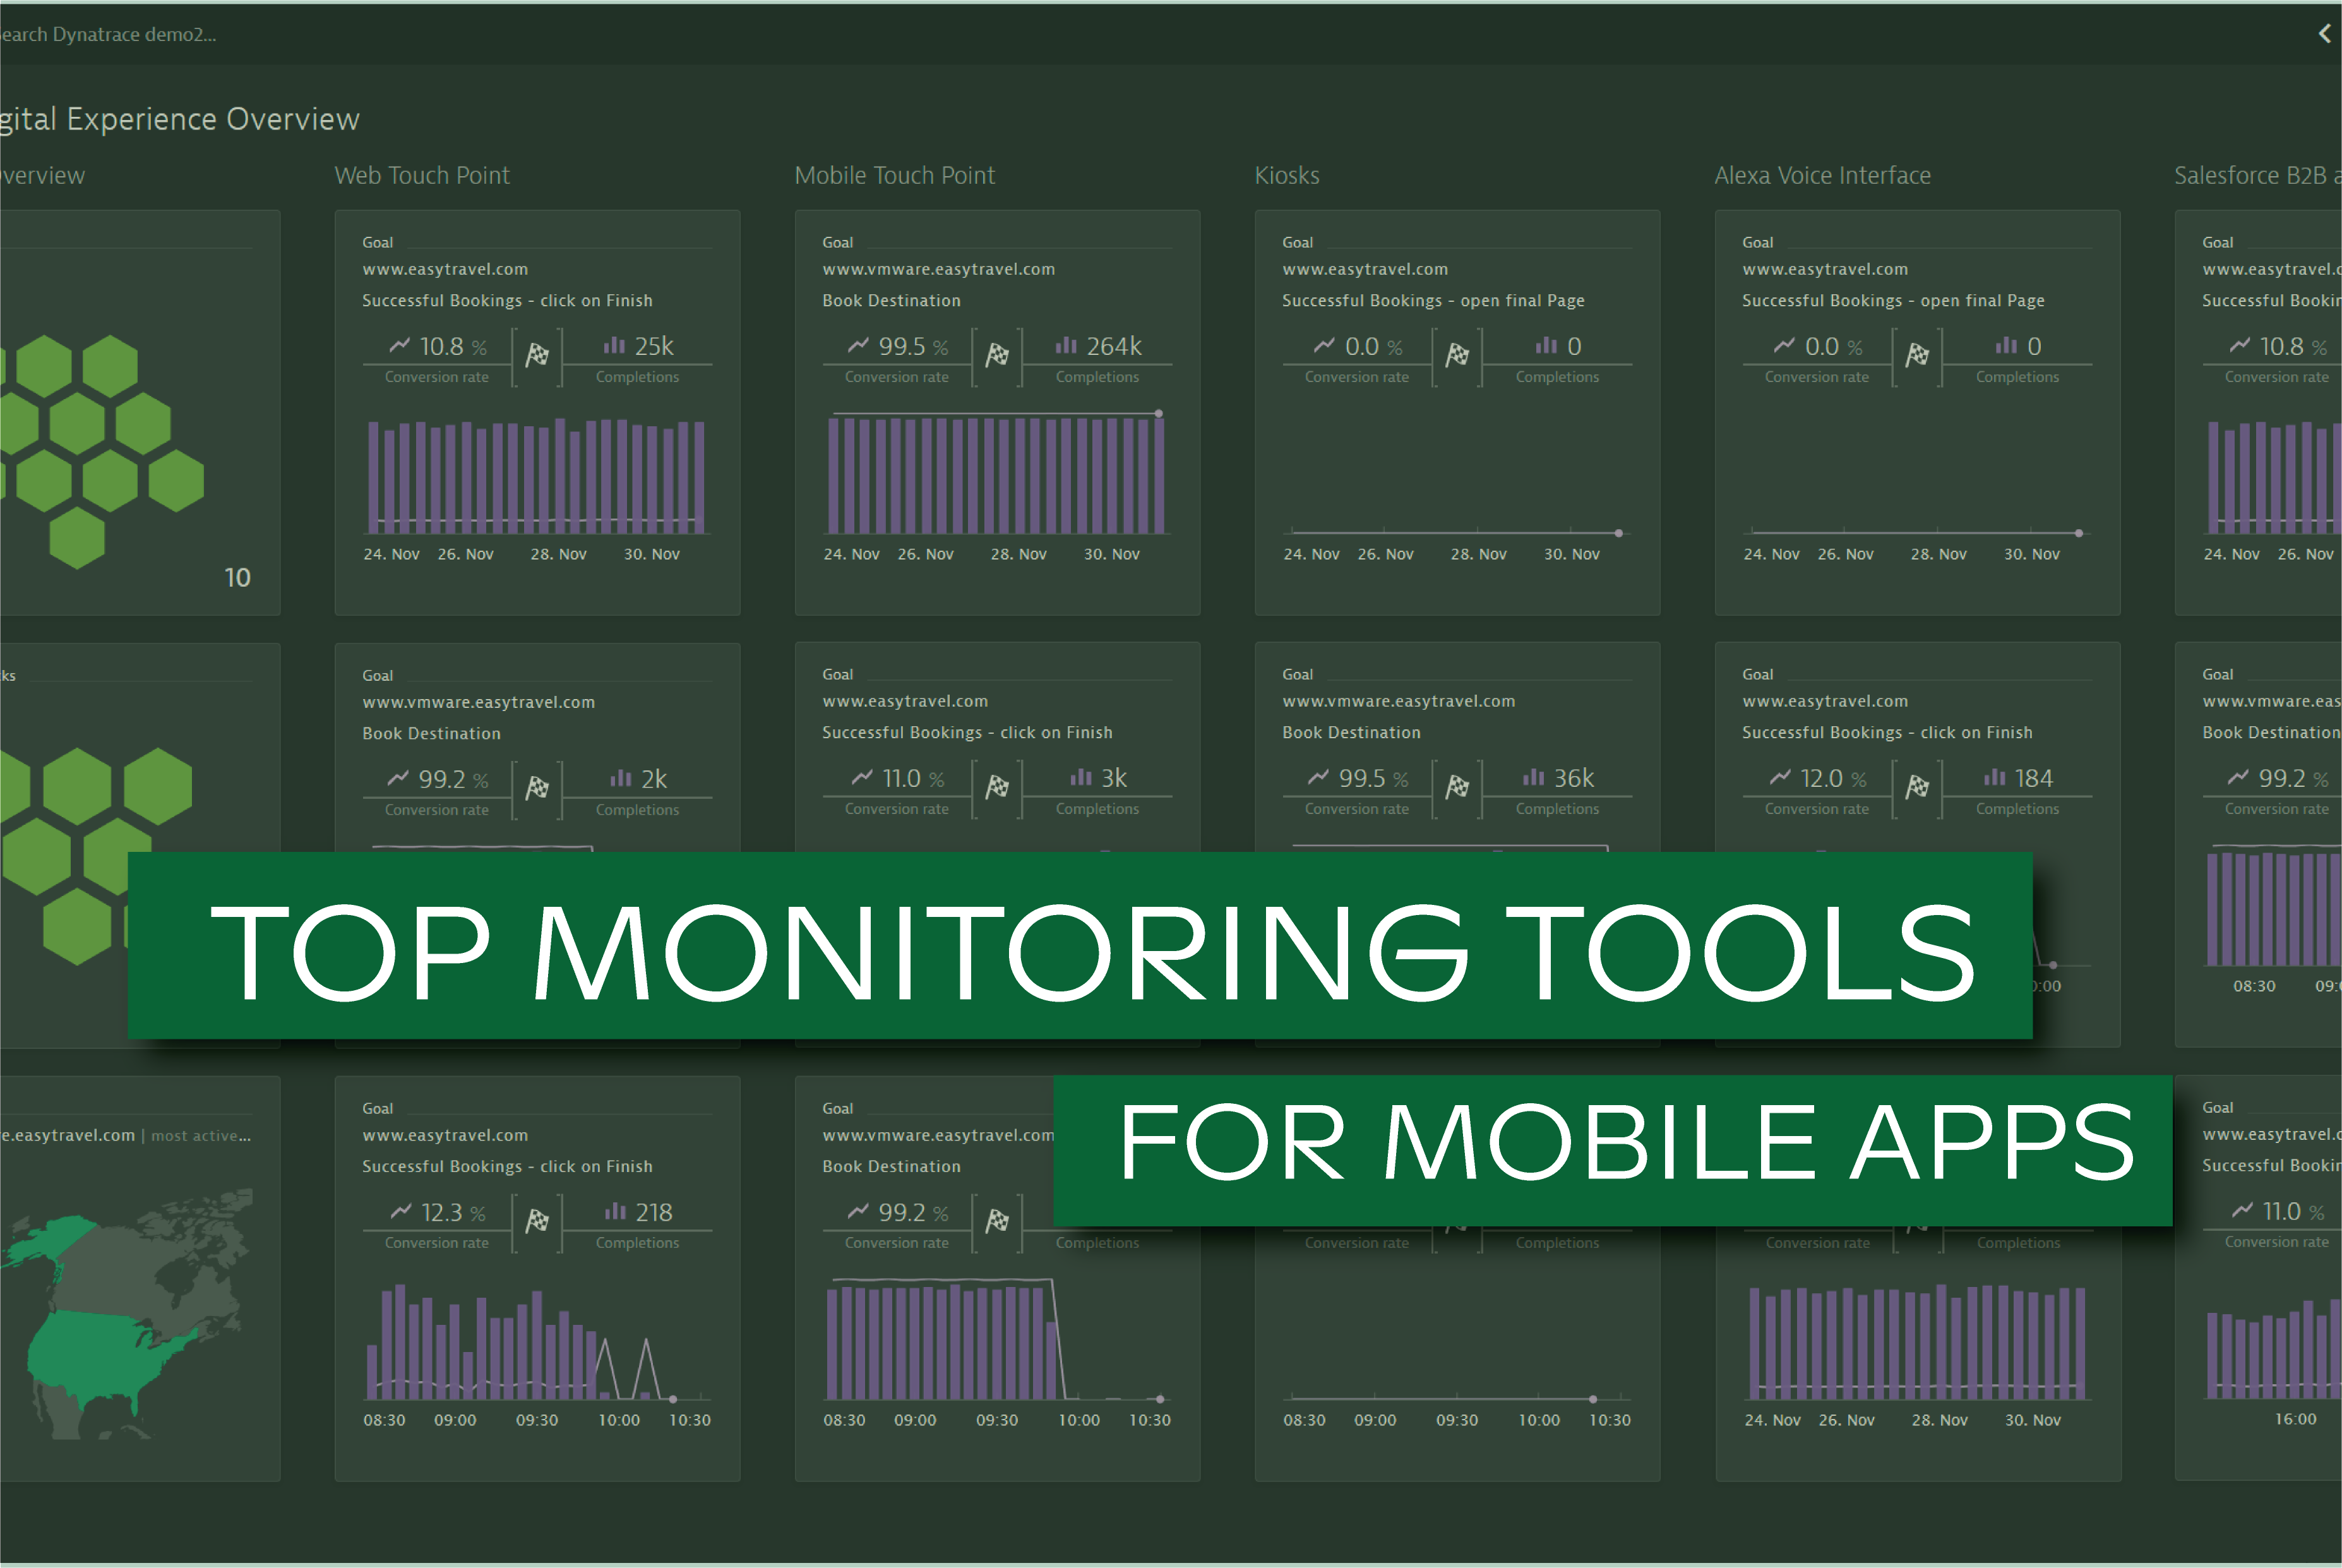
This post focus on my personal top 4 of mobile application performance monitoring tools.
.png?width=960&name=Content%20delivery%20ecosystem%20(2).png)
You might be wondering how I got to this final list when there so many other good application performance monitoring solutions out there, such as Elastic APM, or Heap Analytics. Well, it’s easy: given that 75% of app performance issues are related to the network (source), I strongly believe that app monitoring tools must give the network its deserved relevance. Thus, that was my main criteria - the network focus.
Here’s what you need to know about each one of them:
New Relic
The most complete solution
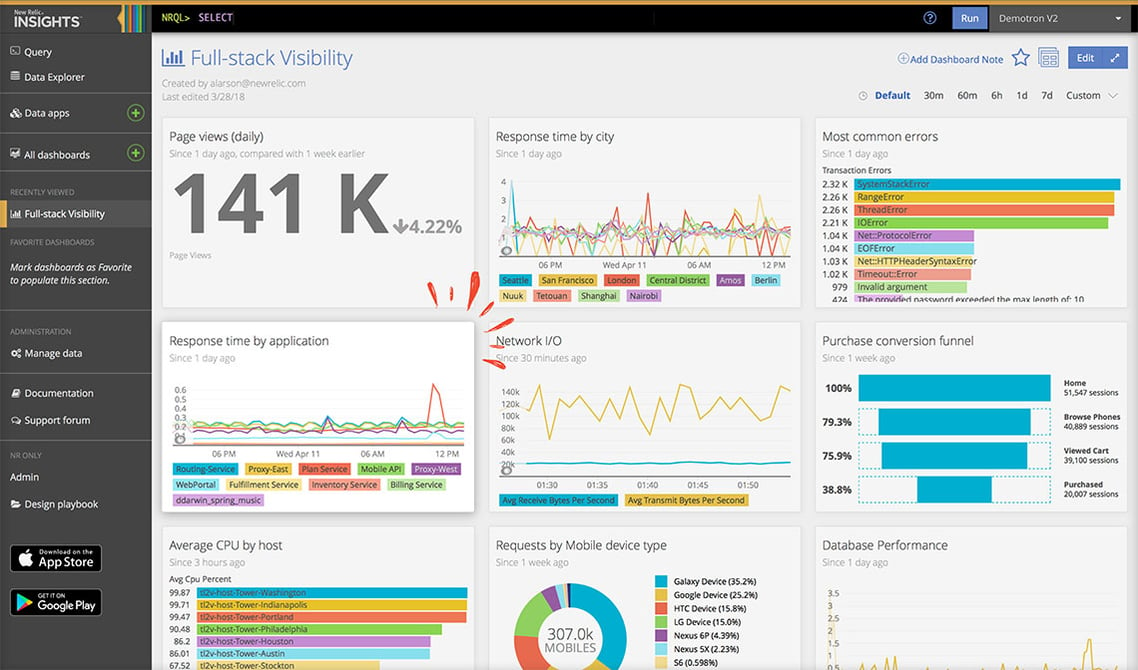
With more than 15.000 customers, New Relic is the most complete solution in the market. It allows gathering a lot of different data, in order to improve your probabilities of making the right decisions. Being cross-platform and easy to add to any mobile app, New Relic creates a very intuitive and comprehensive report with full stack visibility. This enables you to see the time tracing of the path of a single request from end-to-end (e.g. DNS resolution, network, processing, etc...), from the mobile app to the server and back.
New Relic also focus on troubleshooting and error detection, helping you to quickly find root causes and fix issues faster. The less positive point of New Relic is the price: 999$/month/app could be an impediment to be used by others than big companies.
Pros:
+ Easy to install
+ The most complete report
+ Geographic performance reporting
+ Full stack report tracing
Cons:
- The price
Dynatrace
End to end network monitoring
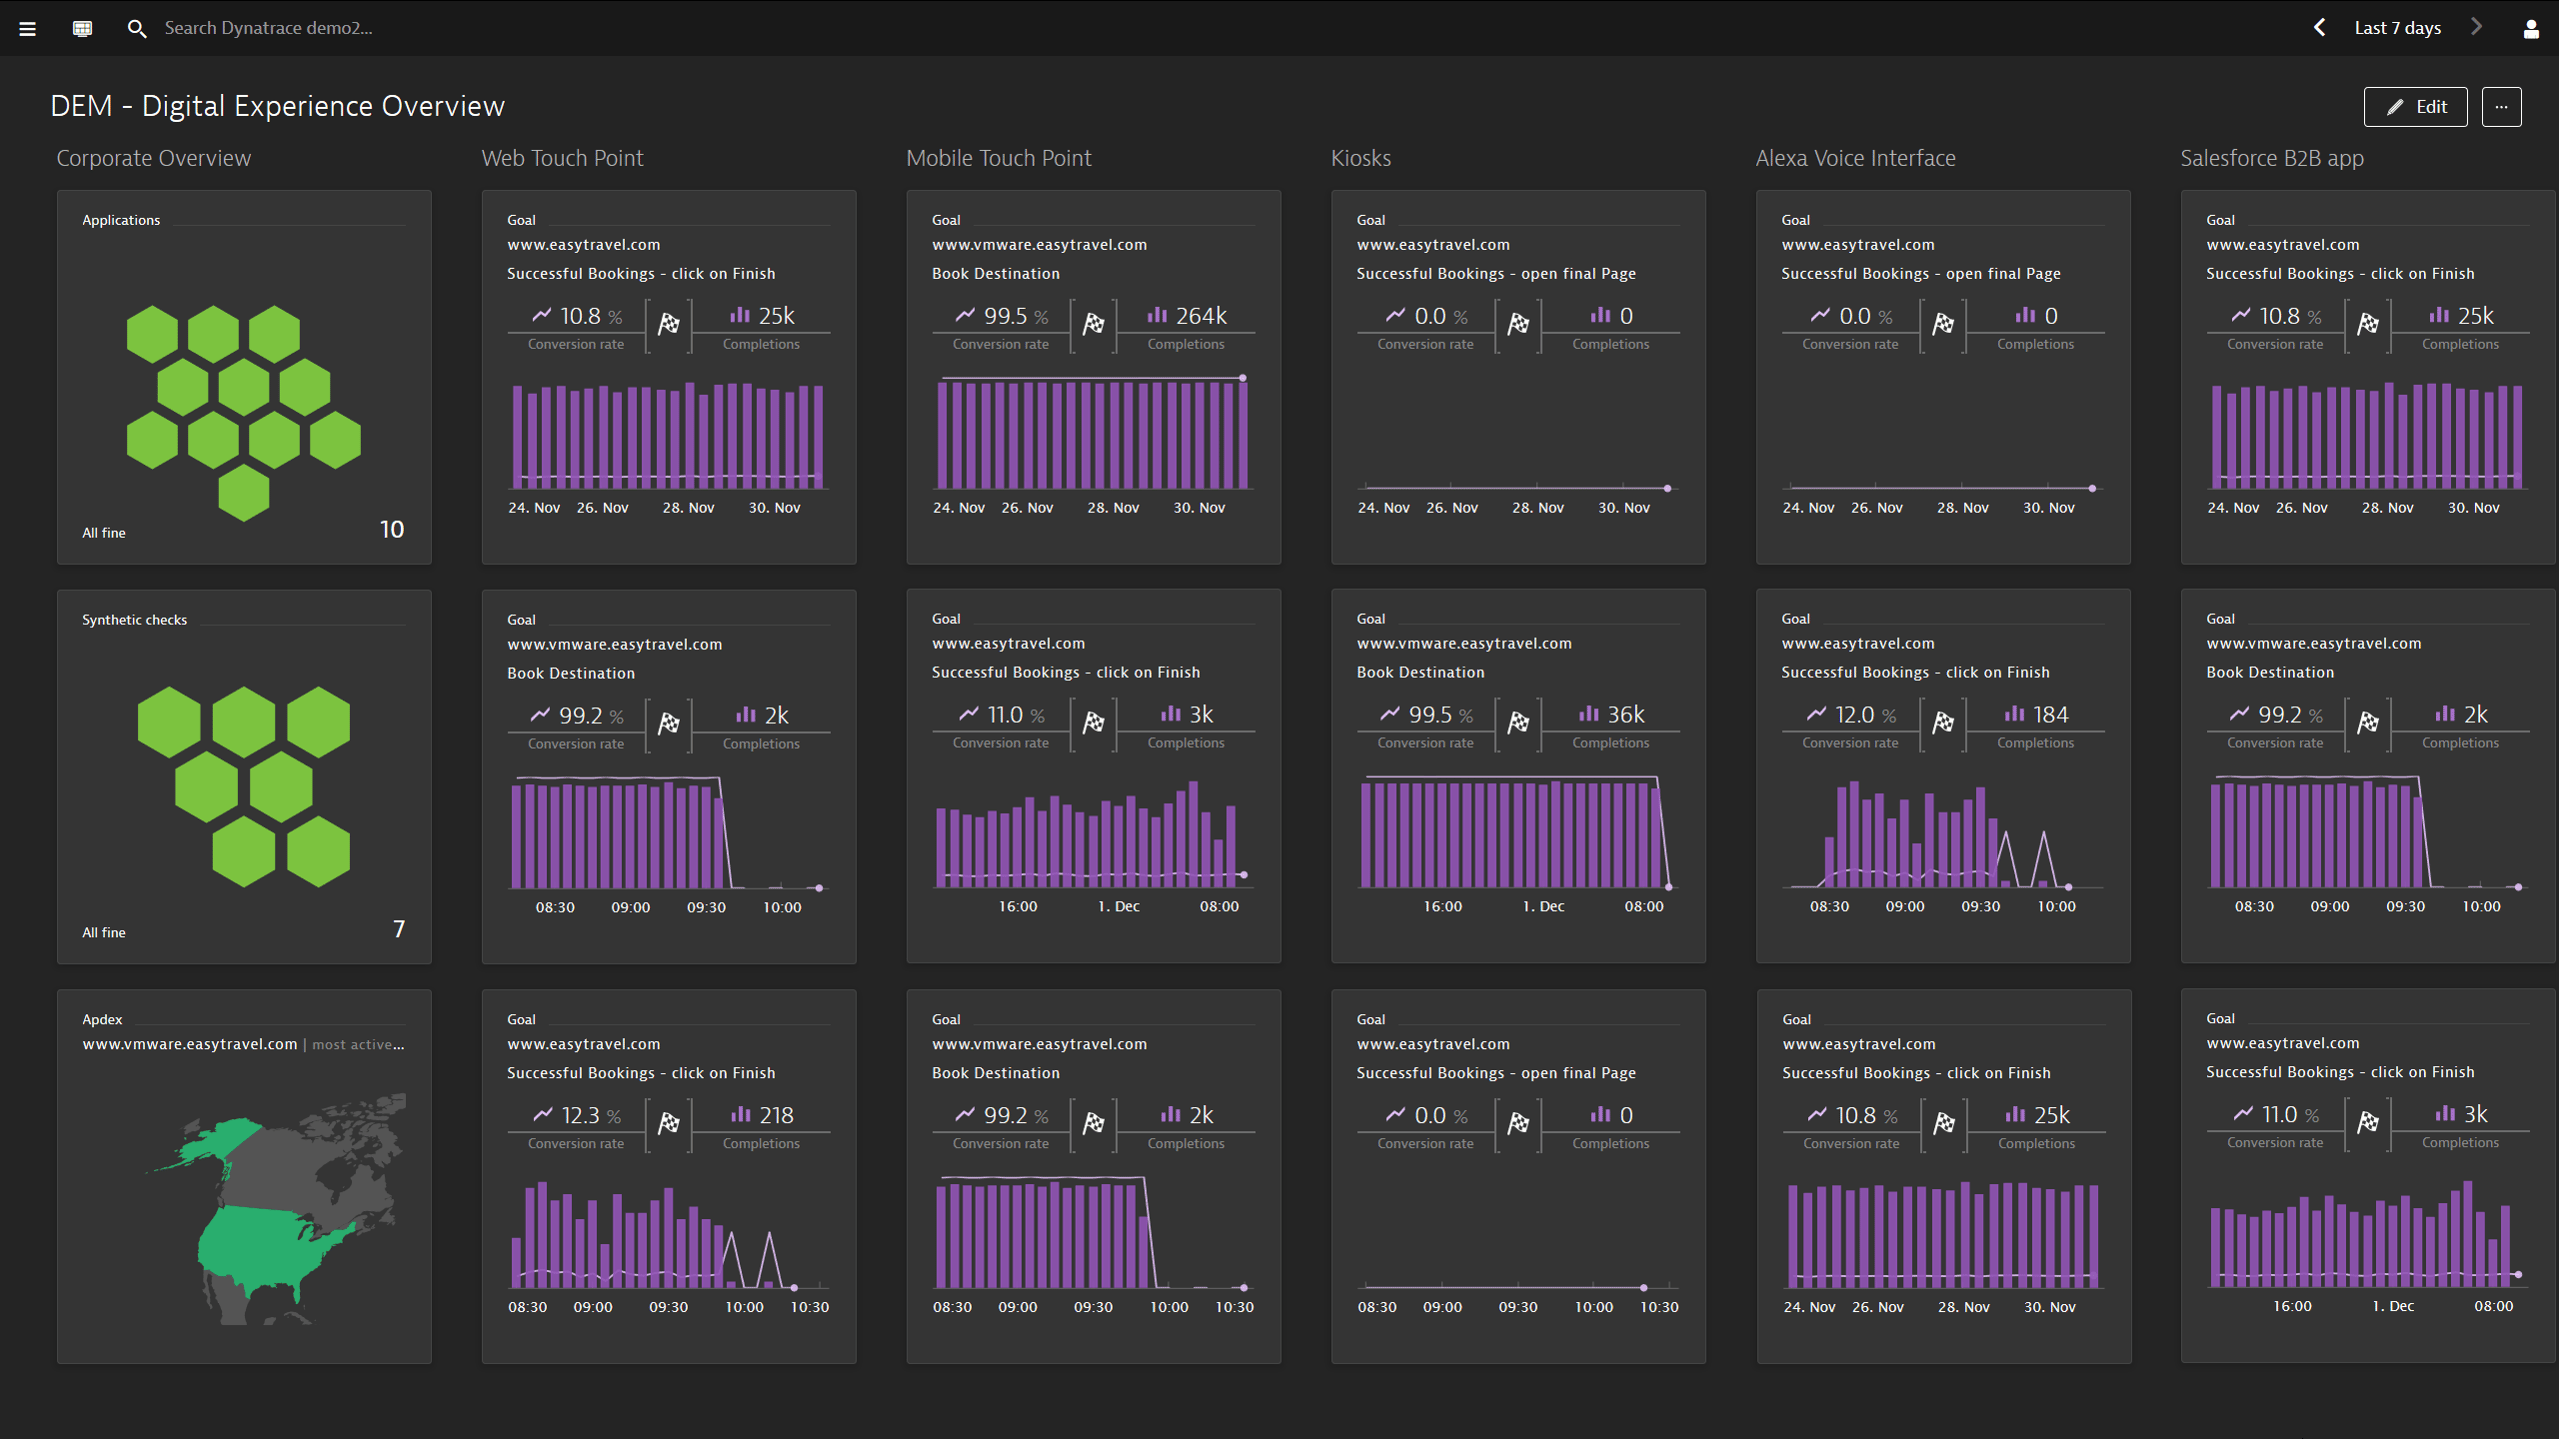
Dynatrace is another excellent solution. It was a tight fight to get the first place against New Relic, but since it has a less intuitive and more complex report for the customer, it appears as our second choice. The features are all very similar to New Relic, but Dynatrace is more like a "all-in-one" solution to monitor infrastructure, apps and users behavior. When comparing with New Relic, Dynatrace is not a mobile-first solution and is not as easy to understand.
Even though it is still expensive, the pricing is more adequate to small companies. The cost is proportional to the number of users of the app to be monitored and, as consequence, to the incoming revenue.
Pros
+ Crash analytics
+ Detailed HTTP session analysis
+ End to end full stack request tracing
Cons
- Less intuitive than New Relic
- Not so easy to use
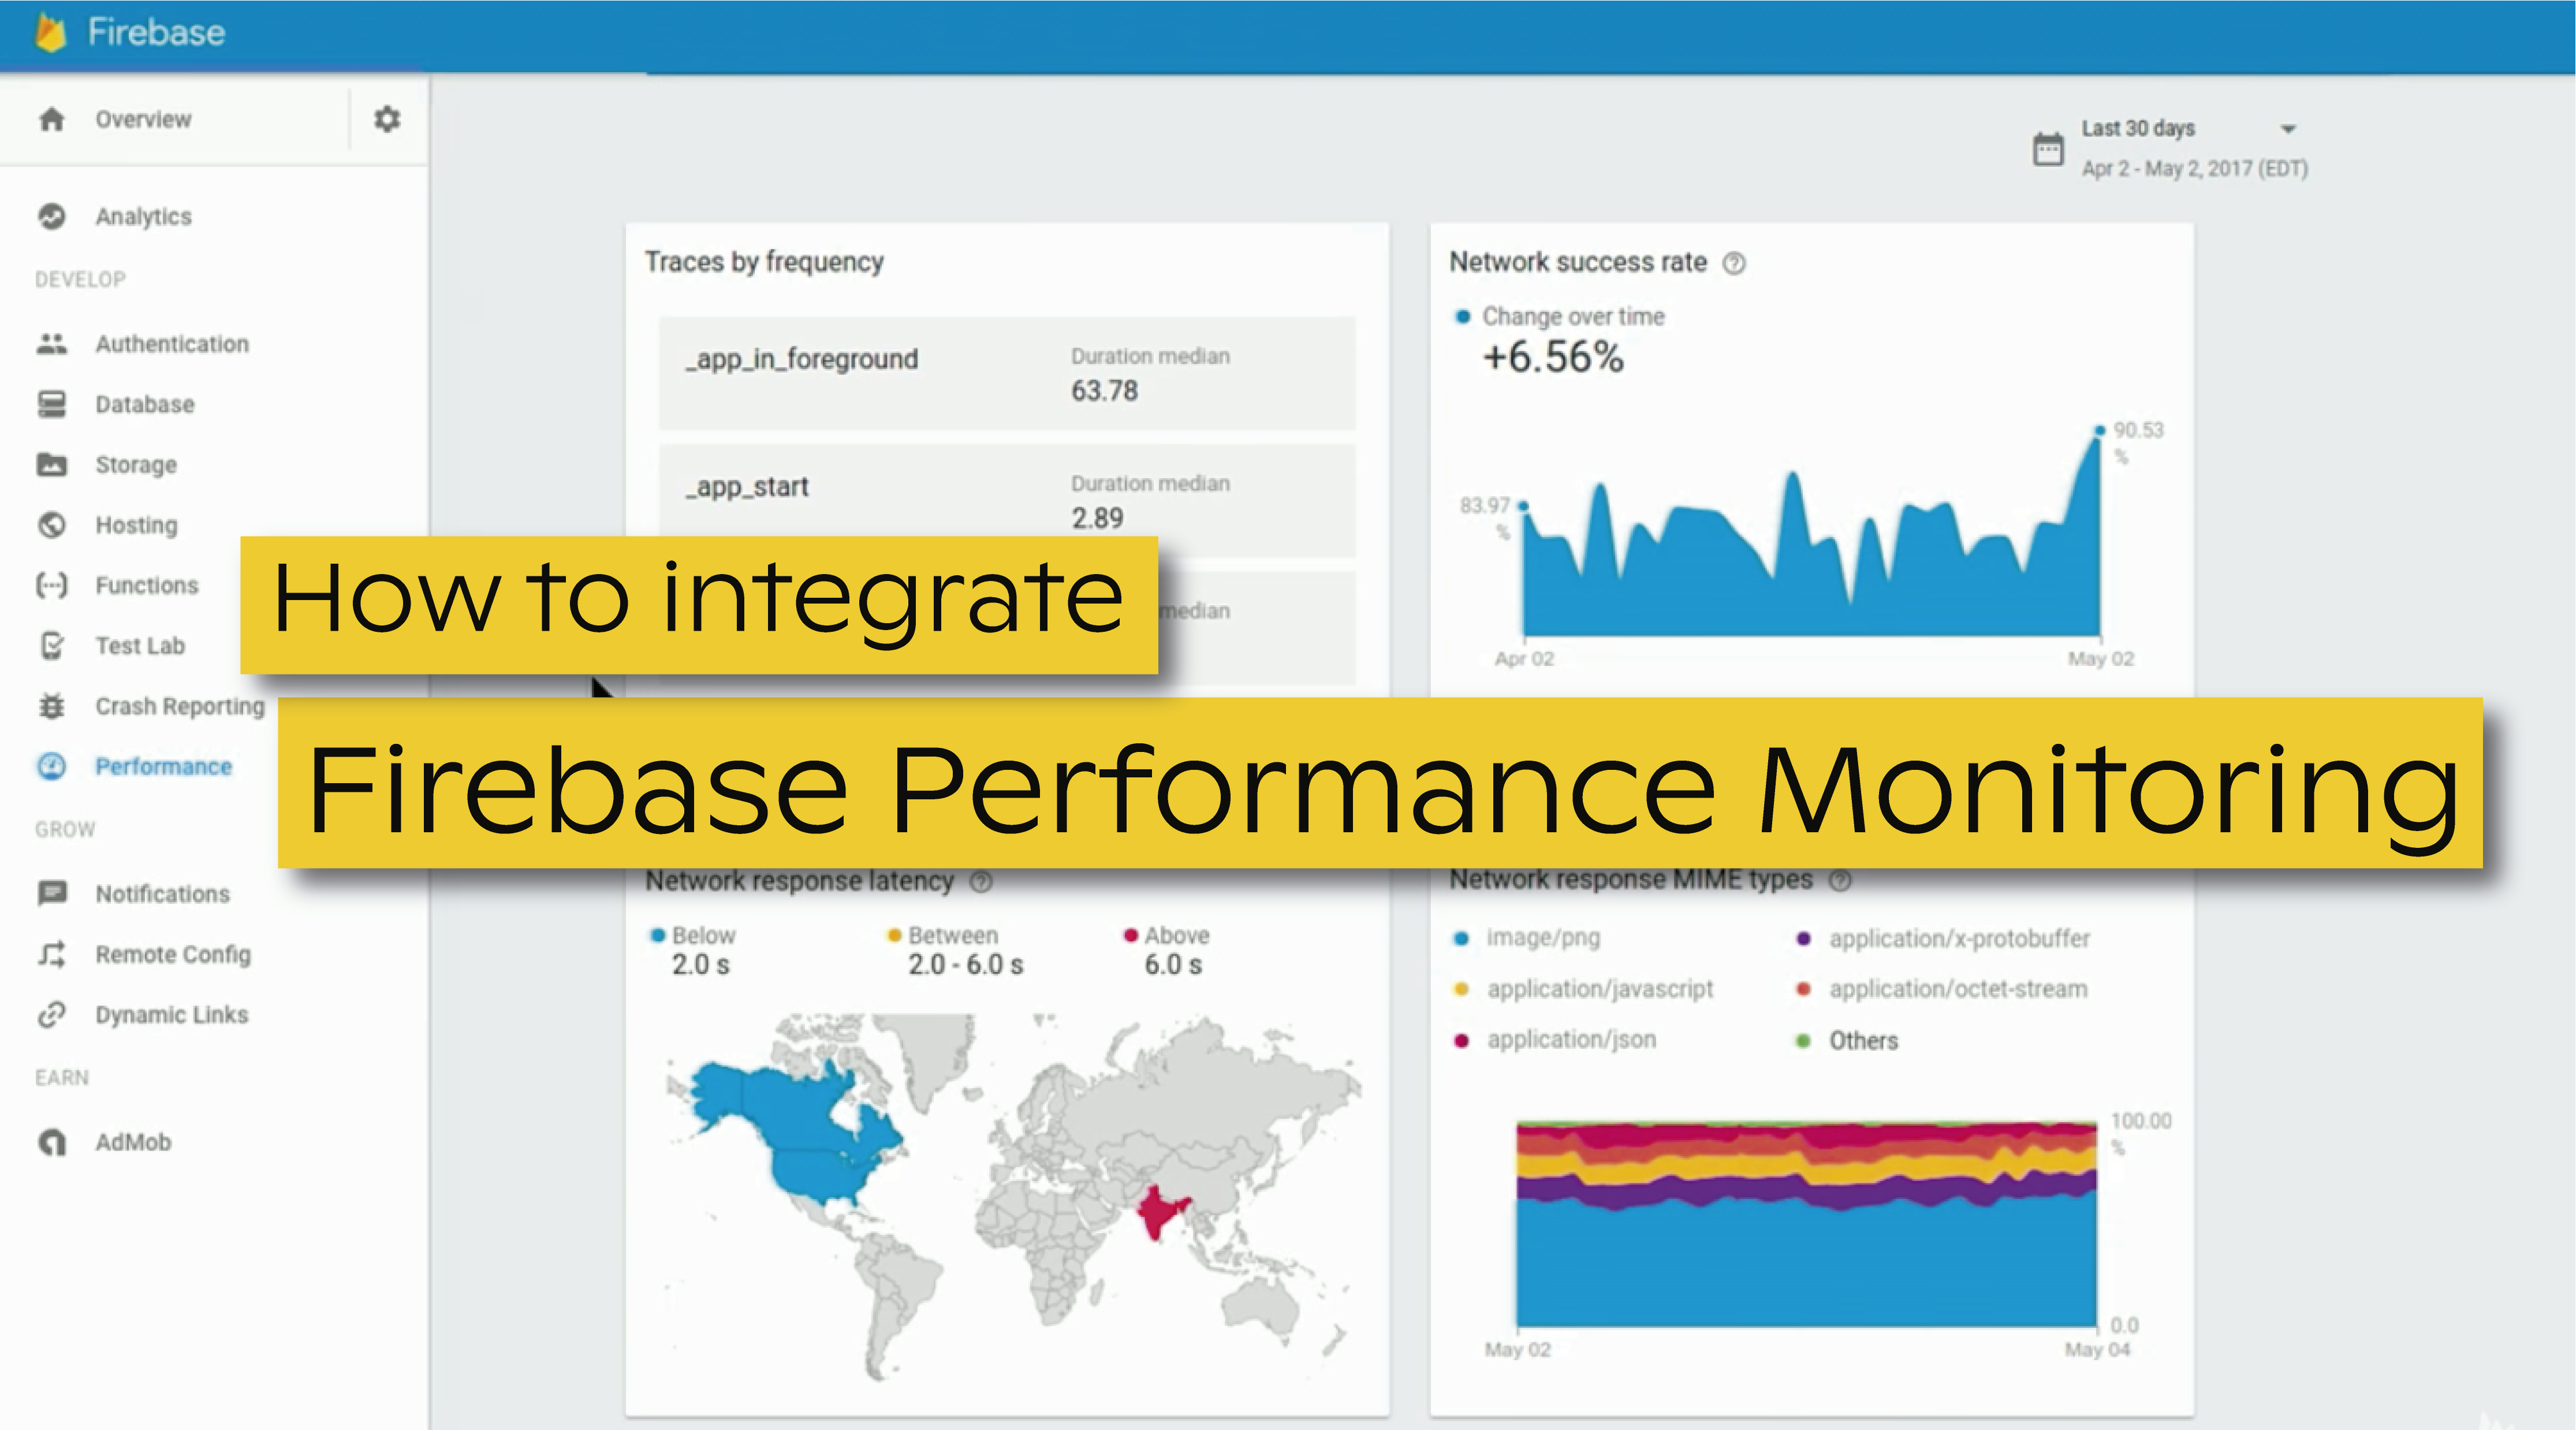
Firebase Performance Monitor
Another great product from Firebase
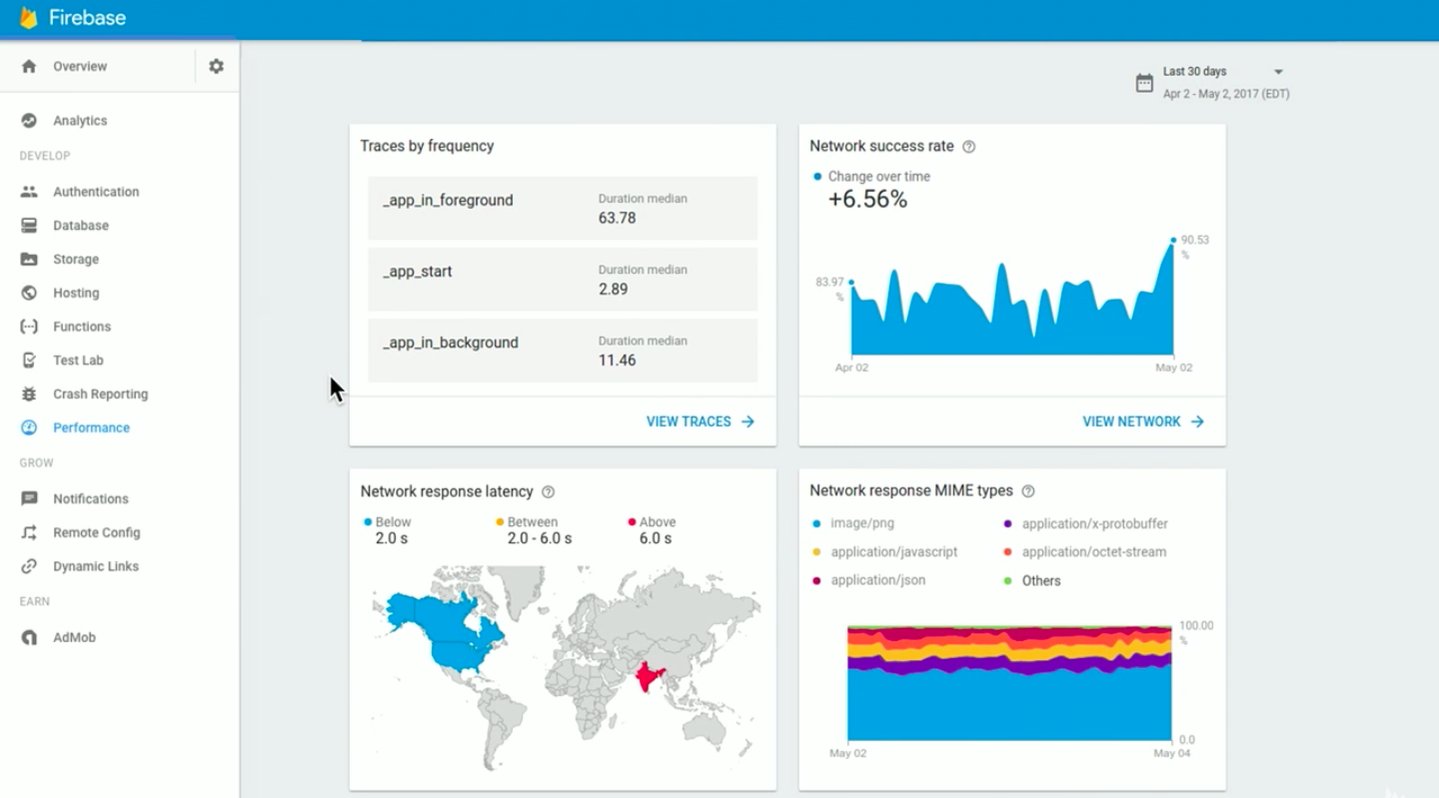
Most of us are familiar with Firebase, whether because of their push notification solution or because of the “database as a service” system Cloud Firestore. What is new to some people is the amazing variety of Firebase products to “help mobile app teams succeed”.
One of these products is the Firebase Performance Monitor. A free, easy to use, cross-platform, performance measurement tool. A quick look into the “Getting started” guide suggests that Firebase Performance Monitor collects almost automatically the following network metrics:
- Network URLs (not including URL parameters or payload content) and the following corresponding information:
- Response codes (for example, 403, 200)
- Payload size in bytes
- Response times
- Duration times for automated traces.
Pros:
+ Automatically collect multiple performance metrics, including app startup time and HTTP/S network requests
+ Network failure reporting
+ Free to use
Cons:
- The report is not as complete when compared with other paid solutions
- No end to end request tracing
Cloudflare Mobile SDK
A free and simple network monitor tool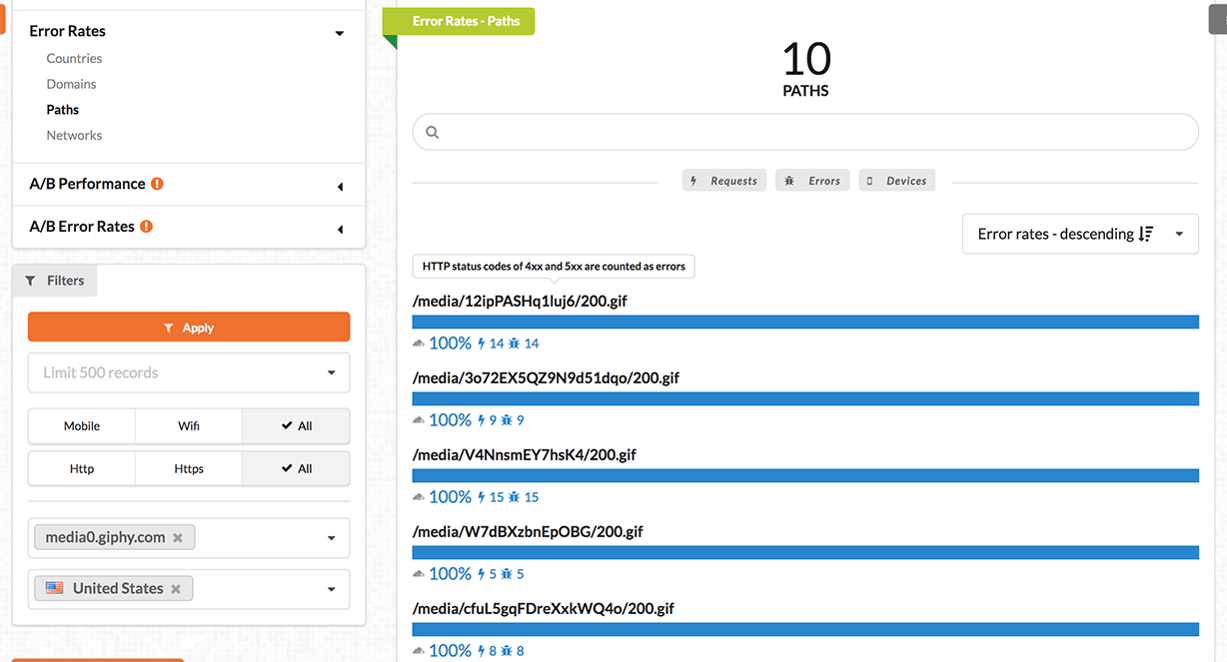
Cloudflare is a well know and succeeded CDN, focused on security protection and performance improvement. The network monitor tool by Cloudflare is part of their mobile SDK and offers the possibility to make a detailed analysis of your app network performance. Even though it does not offer the same level of features as the paid solutions, Cloudflare Network Monitor tool is an excellent starting point to get insights on the network performance of your app.
This monitoring tool is the simplest of all the four analyzed in this post, but it does the job. Plus, it is a good option to consider for people looking for a free version.
Pros:
+ Easy to install (Even though some setbacks may occur. Read our experience integrating Cloudflare SDK).
+ Free to Use
Cons:
- The report is not as complete when compared with other paid solutions
- No end to end request tracing
As a final note, all these tools support Android and iOS. Choose the best fit for you and start monitoring!