TL;DR: Users are not all the same, and not all experience your app in a good manner. Why? Because they are spread through tiered locations, each presenting its unique challenges. Codavel is here to help you!
Users are not all the same
Direct to the point, no, they aren’t! Not all users get the perfect user experience. Some do, don't get me wrong. Internal business analytics may even indicate that they are the vast majority. But not all of them. Let's look at some data to make it crystal clear.
Don't take just my word for it. Let's look at Uber's data. Uber has studied and measured the tail-end latencies of their customers in multiple locations and has also looked into means to improve it. Without examining it and knowing Uber's team, knowledge, and investments, you would imagine that all users were getting the best possible network experience. Let's focus on the post's global map, showing latency variance and how it changes over distinct locations. The result? Every region presents users in areas with a good network experience and users in areas with abysmal network experience. Even in Europe or North America regions. If Uber suffers from these effects and issues, why wouldn't you suffer as well? Hint, you do. You may just not be aware of it.
But why? Allow me to give you some insights.
Geography matters
I know. You were expecting network conditions to be better in developed countries. And they are (to some extent). However, that awareness and classification (good region vs. bad region) is insufficient and does not give you the complete picture. We need to look into cities, country by country, to better understand what is really happening.
Let’s look into official data regarding cellular network quality in India from the Indian government and their white paper on the matter. The Indian government has been collecting cellular network quality data since 2018. This data shows that average transfer speed fluctuates a lot between cities, with some cities having more than 3x higher transfer speeds than others.
Also, let’s look into Tutela’s network experience report in India. In it, we can clearly see and distinguish 4 tiers:
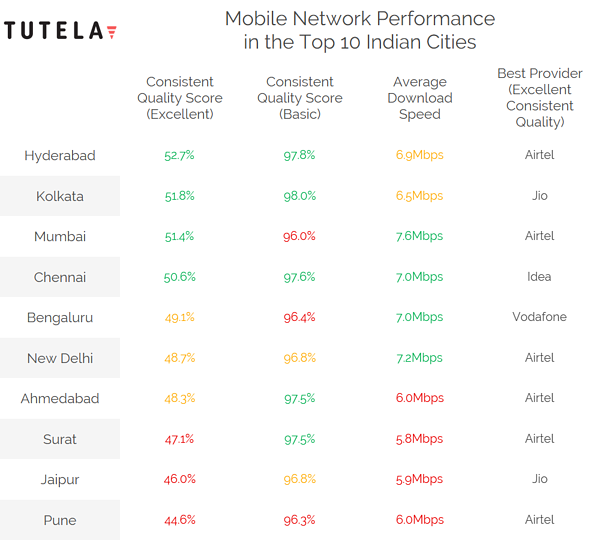
Source: India - Network experience across the largest 10 cities
1. Cities with great metrics (cities with all green metrics)
2. Cities with challenging metrics (cities with at least 2 green metrics, but 0 red metrics)
3. Cities with poor metrics (cities with 1 green metric, or 1 red metric)
4. Cities with bad metrics (cities with at least 0 green metrics)
Tutela's report also shows that different ISPs behave differently between cities adding more chaos to the equation.
Location Asymmetries & Tiering Classification
Let’s dissect the user experience in each of these region tiers.
Tier 1 > Users experience good quality service
Tier 2 > Users experience ok quality service, but far from perfect
Tier 3 > Users experience poor quality service, with service experience being almost unbearable
Tier 4 > Users experience bad quality service and will not use your services or app
The vital part to retain here is to classify your users in a tiering location-based system. You are probably suffering by not being aware of it. My question to you is, are you managing your app to consider all these variations? Also, why you may not be seeing this pattern.
Metric Asymmetries
You may think that you hardly see users suffering from poor experience in your service metrics. That is because of data bias. Users in tier 1 locations are exposed to a better user experience and thus tend to spend more time using your app, and the more time a user spends in your app, the more metrics you collect about their experience. On the other hand, users in tier 4 locations are exposed to an awful experience, and therefore they spend their time scarcely in your app, causing you to collect fewer metrics about their sessions. As a side effect, you have more data related to tier 1 cities than other lower-tier cities, causing a data asymmetry towards the tier 1 cities, making it harder for you to get the big picture of what is happening with your app or service.
Impact of Tiering Regions in Use-Cases
Now you understand the issue of tiering regions and have some hints on why it is challenging to be aware of it. Let's detail the impact of having users in low-tier regions and the importance of the issue to some use-cases.
Video Streaming
Video streaming services rely heavily on 3 important KPIs: video startup time, buffering events, and average video quality (for services that use adaptive video mechanisms). Users in tier 1 locations can get video startup times under the 2-second mark, suffer no buffering event, and experience streaming at HD quality. On the other hand, users in tier 2 locations may take 5 seconds to start playing a video, occasionally suffer from buffering events, and experience streaming at SD quality or even LD quality. For users in tier 3 locations, oh my… They can experience video startup times higher than 8 seconds, when the video finally starts, it stops all the time due to buffering events, and it is always kept at LD quality. For users in tier 4 locations, video streaming is hardly an option for them.
E-Commerce
Some of the most important KPIs for e-commerce services are: time to interact, time to meaningful data to be shown, and time to show price and images on a product page. Users in tier 1 cities can interact with the app within a second, after a search, see relevant products in a second, and access all images and see the price of products in a breeze. Users in tier 2 and tier 3 locations see some loading spinning wheels and always feel that the app is lagging behind their pace. Meanwhile, users in tier 4 locations spend more time looking at the spinning wheel than looking into products.
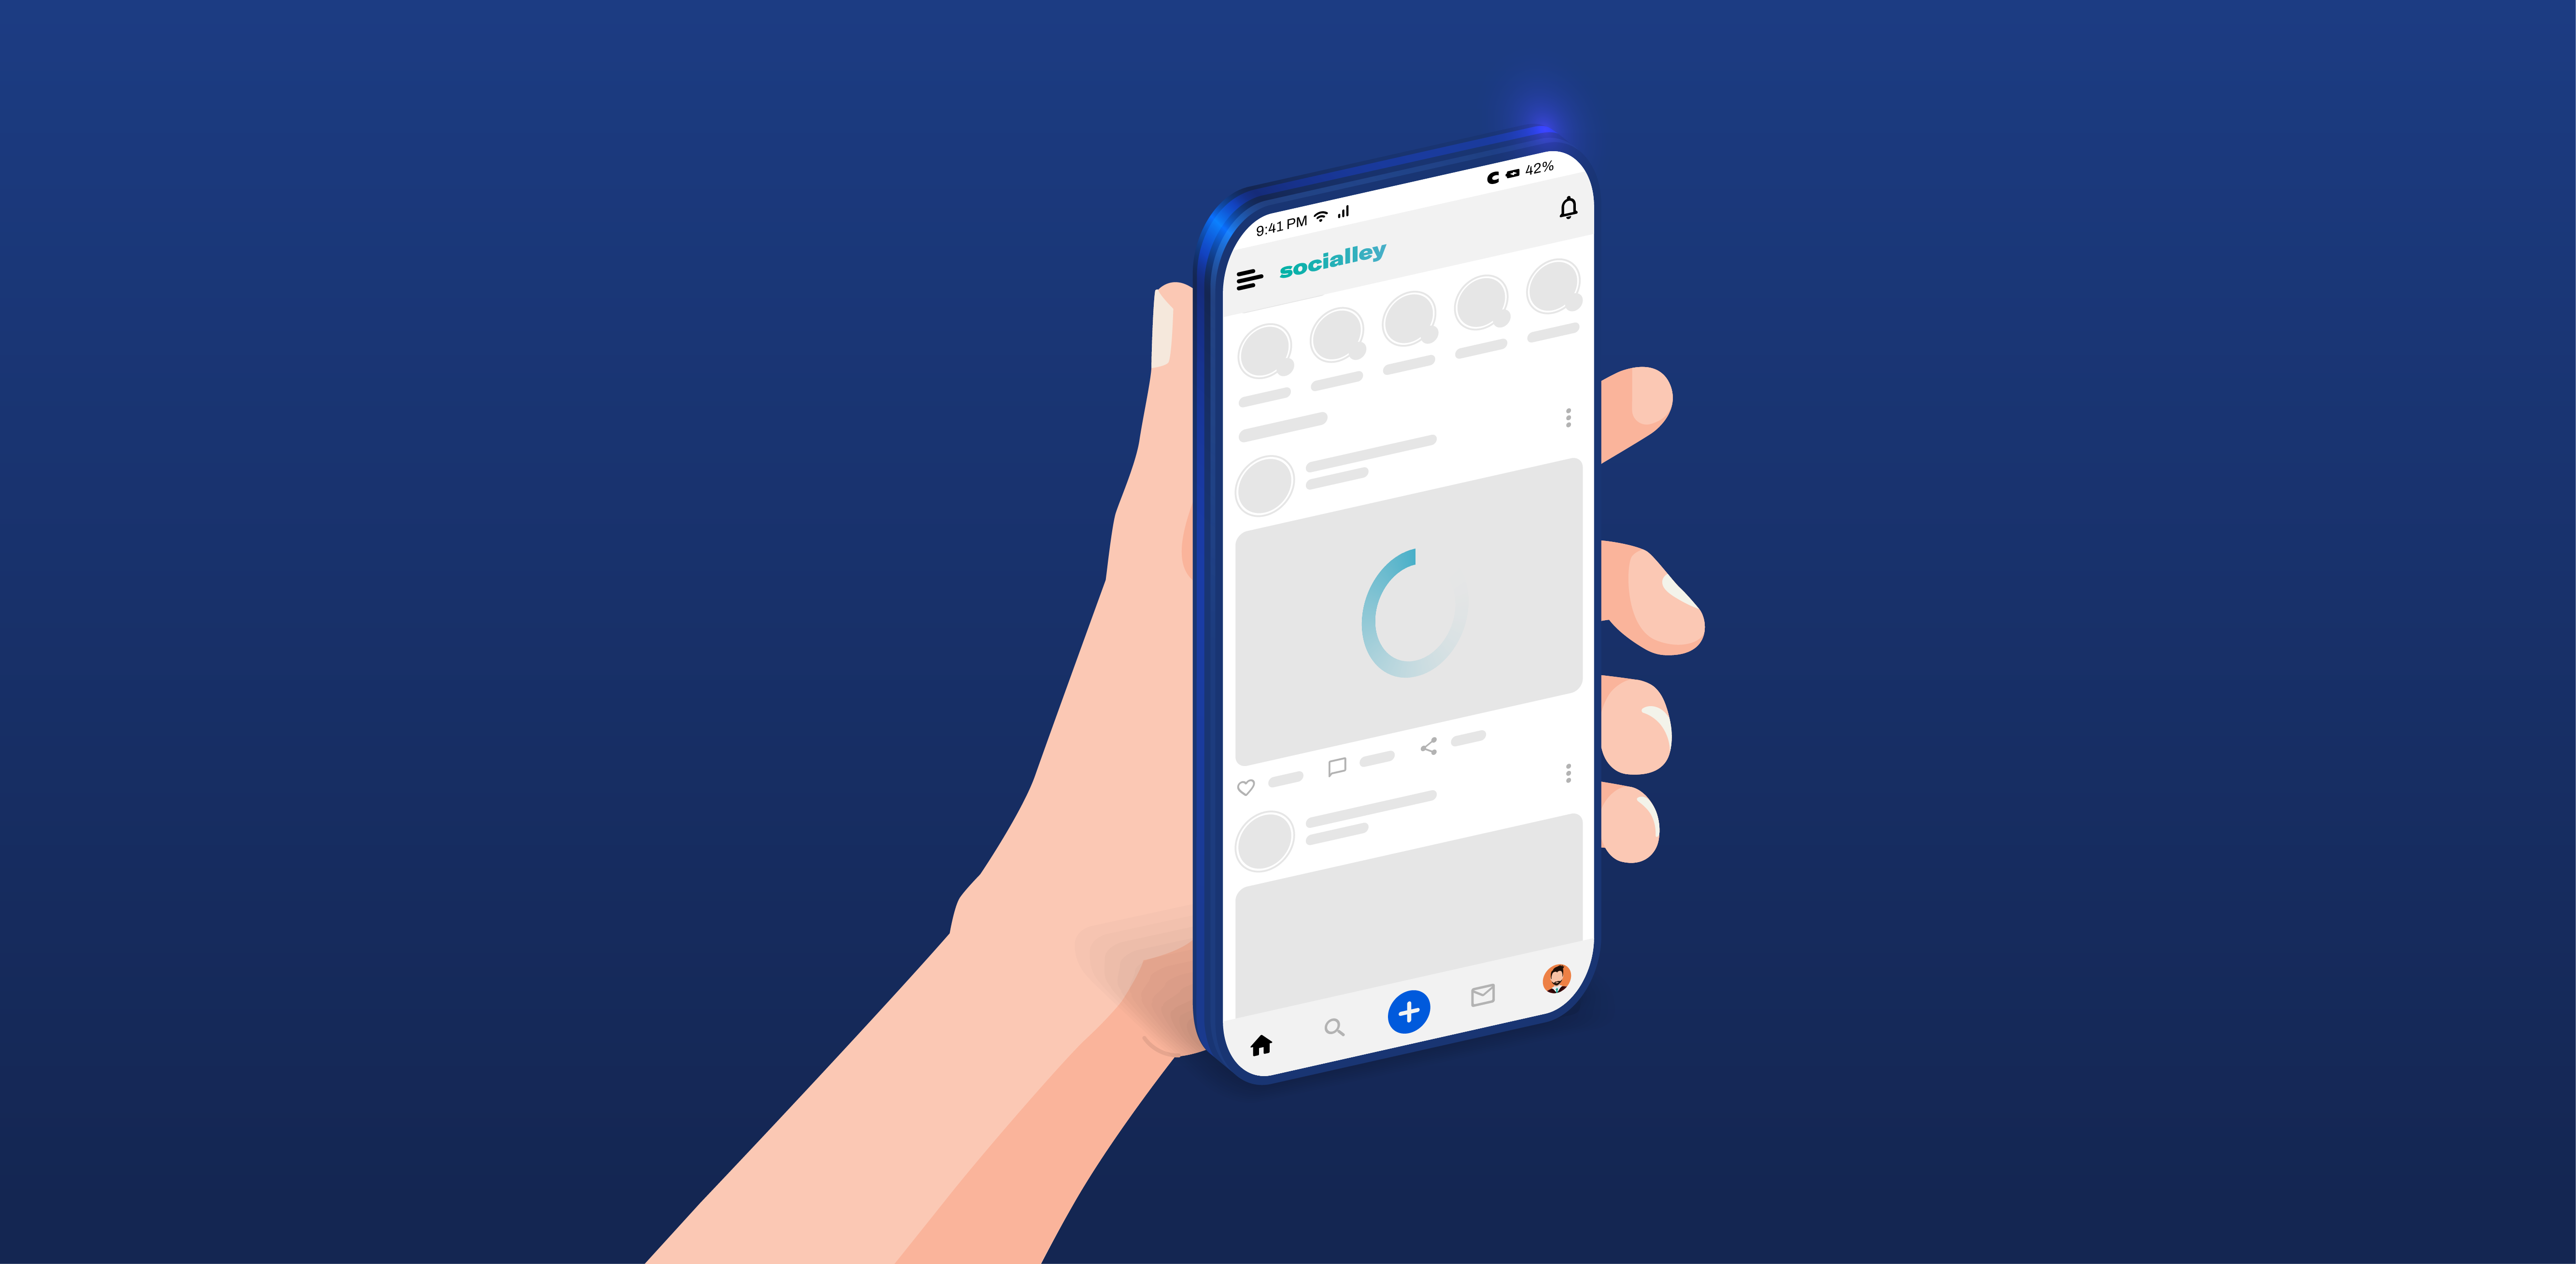
Social Network
Nowadays, social networks are more than a collection of unlimited images being scrolled on screens. They depend more and more on video to engage with their users. So, similar to the video streaming use case, social network users can have distinct experiences based on their tier location. With respect to the scroll behavior and image loading times, the lower the tier city, the more spinning wheel the user sees.
As a consequence, independent of your user case, for users in lower-tier cities:
- You sell less.
- You show fewer ads.
- You engage less with them.
- You have fewer chances to monetize.
So, what can you do to overcome all these challenges and improve your app?
Codavel CDN to the rescue
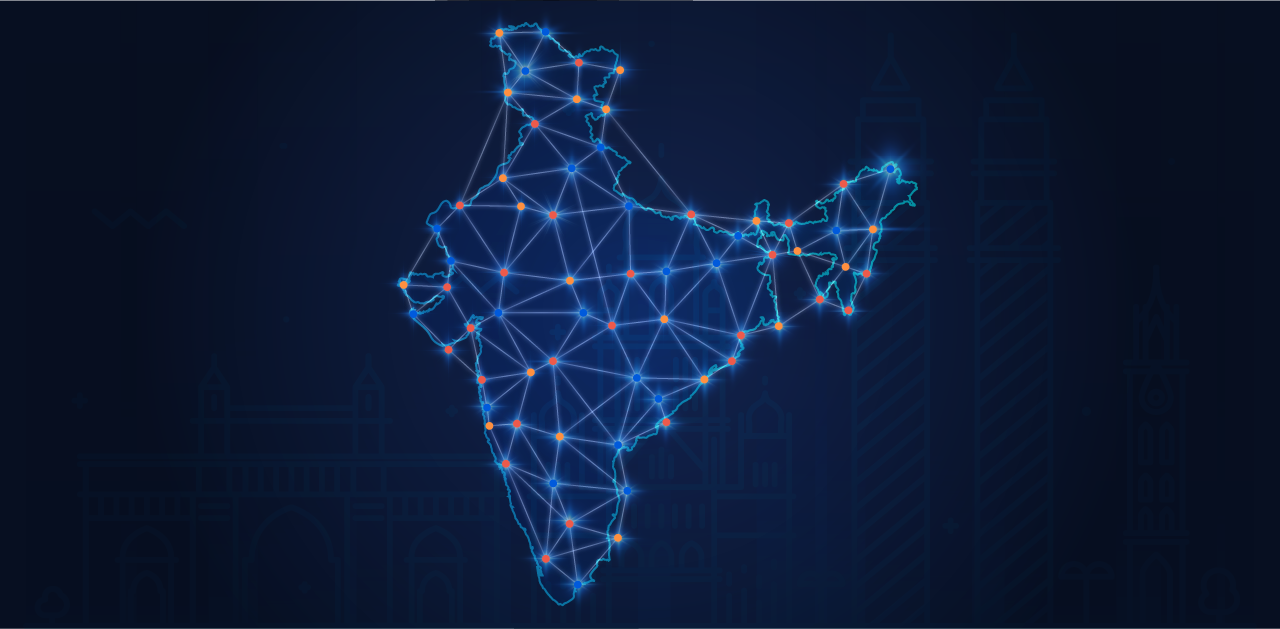
We at Codavel are crazy about improving content delivery. To achieve that, we have built a mobile-first CDN, tailor-made to overcome the challenges presented by the wireless last mile, especially present in emerging markets, such as India.
By employing Codavel CDN, an app or service can further improve the user experience of users in tier 1 cities. But more importantly, it can bring users from tier 2 and tier 3 cities to have an experience almost equivalent to users in tier 1 cities. Users in tier 4 cities become equivalent to users that belong to tier 3 cities, or even for some users, tier 2 cities.
Take a look at our latest performance report for video streaming. A sneak peek, Codavel CDN can reduce the user session dropouts due to time to start video by 80%!


.png)